

Data Storytelling and Infographic Design Corporate Training
Data Storytelling & Infographic Design Corporate Training
A 13-hour instructor-led program that teaches teams to build compelling data narratives, design clear infographics, and present findings with confidence.
Instructor-led group trainingVirtual / on-site / off-site10 languagesDelivered inEnglish, Spanish, Mandarin, German, Arabic, Portuguese, Hindi, French, Japanese, Italian100+ countriesWe have delivered inUnited States, United Kingdom, India, Canada, Germany, France, Netherlands, UAE, Saudi Arabia, Singapore, Australia, Japan, Brazil, South Africa and 90+ more countries
How we build a compelling data story team
The Edstellar DATA STORYTELLING Capability Model
Diagnose
Assess how your team currently presents data and where stories lose impact before training begins.
Standardize
Establish a shared story language: narrative structure, chart rules, and presentation standards.
Practice
Run guided role plays and presentation practice that build narrative and delivery muscle.
Measure
Track progress through story clarity, visual quality, and showcase scores tied to real work.
Scale
Spread the storytelling toolkit across teams with repeatable formats and design checklists.





Need more than one program?Get a group quote
Trusted as a Leading Corporate Training Provider by
















Program Overview: What is Data Storytelling and Infographic Design?
Data Storytelling & Infographic Design is an instructor-led corporate training program for teams who present data to stakeholders and need it to land. Over 13 hours, participants learn to structure narratives, design clear infographics, frame findings for business audiences, and present with confidence. Learning happens through guided role plays and presentation practice, all built around real work datasets.
Each module blends concise instruction with practice: teams storyboard narratives, design infographics, and rehearse delivery in role-play clinics. Instructors coach every round, giving feedback on narrative structure, visual clarity, and delivery before participants present again. Practice builds across the program toward the capstone, a live data story presentation delivered to the cohort. All exercises use the team's own datasets and stakeholder contexts.
Good analysis dies in bad presentations: cluttered slides, buried insights, and audiences that stop listening. This program teaches teams to respect the audience's attention, leading with the finding, supporting it visually, and closing with a clear ask. They return presenting data that moves decisions instead of meetings that drift.
The capstone is a live data story showcase: each participant presents a real work dataset as a structured narrative with designed infographics, in front of instructors and peers. The review covers story arc, visual honesty, and whether the ask was unmistakable. Graduates take home their polished deck, a storytelling template, and presentation habits they can use in the next stakeholder review.
Across five modules, teams move from storytelling foundations to a live data story presentation. The emphasis is on repeatable techniques (story structure, chart selection, infographic design, objection handling) that keep working long after the program ends, so clear data communication becomes a team habit rather than a one-off workshop.
What's Included in this Workshop for Your Enterprise Teams
- 1
Guided role plays
Practice presenting data stories and handling questions in instructor-led scenarios.
- 2
Capstone showcase
Design an infographic and present a full data story to the cohort for review.
- 3
Take-home toolkit
Story frameworks and design checklists your team can reuse immediately.
- 13 hours of instructor-led sessions, onsite or live virtual
- Hybrid delivery aligned to your team's schedule
- Pre-program storytelling self-assessment for each cohort
- Post-program story templates and design checklists
- Course materials and scenario guides for every participant
- Scheduling aligned to your business calendar
Build your team's skills. Anywhere in the world.
Real-world use cases
from day one
Instructor-led training
for your teams
Delivered globally
in 100+ countries


Enterprise Training Solutions Customized for Your Company
One partner for instructor-led corporate training, delivered the way your teams work.
Request a Training Quote- Customized Training Delivery
- Scale Your Training: Small to Large Teams
- In-person Onsite, Live Virtual or Hybrid Training Modes
- Plan from 2000+ Industry-ready Training Programs
- Hands-On Labs on Live Infrastructure, Led by Industry Experts
Data Storytelling and Infographic Design Course Topics and Program Outline
A 13-hour applied program: storytelling foundations, infographic design, narrative structure, presentation practice, and a capstone showcase.
Built by Edstellar with communication and visual design practitioners
Built by practitioners who coach data storytelling and presentation delivery with real teams every week, shaped around your stack and use cases.
We assess how your team currently presents data so role plays and scenarios target your real communication gaps.
Your team learns story structure, infographic design, and narrative framing, then practices turning numbers into meaning.
Teams rehearse delivery, objection handling, and visual design in guided role plays and peer-feedback practice scenarios.
Your team presents a complete data story in the capstone showcase and leaves with reusable story and design templates.
13 hours of instructor-led data storytelling built on role plays, presentation practice, and a live capstone showcase.
Delivered as
Delivered hybrid, onsite, or live virtual across two days or four half-day sessions, matched to your team's calendar.

Guided practice: rewrite a dense data slide into a clear one-sentence story.
learna)Audience first: who needs to hear the story
b)The message pyramid: one story, one headline, one ask
c)Evidence selection: which numbers actually matter
d)Common storytelling traps and how to avoid them
Guided practice: redesign a cluttered dashboard slide into a clean infographic draft.
learna)Choosing the right chart for the message
b)Layout, hierarchy, and white space that guide the eye
c)Color and typography that support, never distract
d)Honest design: scales, baselines, and avoiding misdirection
Practice scenario: restructure a real report outline into a stakeholder-ready narrative.
practicea)Opening hooks that earn attention in 60 seconds
b)Building tension: problem, impact, and what is at stake
c)Recommendations framed as clear business asks
d)Adapting the same story for different stakeholders
Role play: deliver a five-minute data story to a simulated stakeholder panel.
practicea)Delivery mechanics: pace, pauses, and visual cues
b)Presenting to friendly, skeptical, and distracted audiences
c)Handling tough questions without losing the thread
d)Peer feedback rounds with instructor coaching
Capstone: design and present a complete data story from a real work dataset.
applya)Infographic design sprint for your story
b)Narrative rehearsal with instructor coaching
c)Live showcase: present to peers and instructors
d)Scorecard review and personal improvement plan
Customize this program tailored to your team?
Tell us your training needs: what your team already works with, the level they’re at, and the topics you want them to focus on. We’ll adjust the modules, duration and hands-on labs, and send you a customized outline for your group.
Key Skills and Outcomes Your Team Will Gain
Every outcome is practiced in guided role plays and reinforced in the capstone, so your team leaves ready to present data with confidence.
Structure a data story
Turn raw numbers into a narrative with a headline, arc, and clear business ask.
Design clear infographics
Build clean, honest visuals with layout, color, and chart rules that aid reading.
Frame for the audience
Adapt the same data for executives, peers, and clients with the right depth and tone.
Present with confidence
Deliver data stories with pace, presence, and visuals that support the message.
Handle tough questions
Answer scrutiny calmly and bring the conversation back to the story's core.
Tell ROI and impact stories
Frame results and metrics as value narratives stakeholders remember and retell.
Use reusable templates
Apply story frameworks and design checklists to every report, deck, and review.
Teams that Benefit from this Data Storytelling and Infographic Design Group Training
Built for teams that present data, build reports, and influence decisions. Content adapts to role and experience so each cohort practices the storytelling workflows it owns.
Turn analysis into stories that drive decisions
Analysts practice shaping findings into clear narratives and visuals so reports lead to action, not more questions.
Workflow friction
- Findings buried in dense spreadsheets
- Stakeholders missing the key insight
- Charts that confuse more than clarify
How the program helps
- Reports that get read and acted on
- Numbers presented with a clear story
- Stronger buy-in for key findings
Practice use cases
- variance reports
- board decks
- forecast reviews
- KPI dashboards
Make campaign data land with every audience
Marketers practice turning campaign metrics into narratives and infographics that win budget and stakeholder support.
Workflow friction
- Great results presented flatly
- Metrics decks that lose attention
- Insights that never reach leadership
How the program helps
- Campaign results told as clear stories
- Infographics stakeholders actually share
- Budget asks backed by strong visuals
Practice use cases
- campaign reviews
- content reports
- budget presentations
- insight sharing
Pitch product bets with evidence that persuades
Product teams practice framing research and metrics as compelling stories so roadmaps win alignment and funding.
Workflow friction
- Data-heavy pitches that stall
- Research ignored by decision makers
- Metrics debates without conclusions
How the program helps
- Roadmaps backed by visible evidence
- Research findings that influence bets
- Clearer asks in strategy reviews
Practice use cases
- roadmap reviews
- research readouts
- strategy decks
- metrics reviews
Show clients value with stories they remember
Client-facing teams practice presenting performance data and ROI stories that strengthen renewals and expansions.
Workflow friction
- QBRs drowned in raw metrics
- Value stories that feel generic
- Clients disengaging mid-presentation
How the program helps
- Client reviews that reinforce value
- ROI stories clients can retell
- Cleaner visuals for every pitch
Practice use cases
- QBR presentations
- renewal reviews
- ROI storytelling
- success metrics
Cohorts are grouped by role and experience so scenarios match the presentations each team actually delivers.
Prerequisites: This program suits any professional who works with data and other people. No prior training in design or storytelling is required, and scenarios adapt to your industry and roles. Instructors tune the capstone challenge to your team's real data so the practice feels immediately useful.
Individual Contributor to Trusted Advisor
Start with story structure and visual design, build narrative delivery and audience framing, and finish presenting data stories that hold up under real scrutiny.
One program that grows with professional careers, from storytelling basics to confident, executive-ready data presentations.
Mixed cohort, or several teams at once?
We can tailor the training to different teams, roles, and experience levels within the same program.
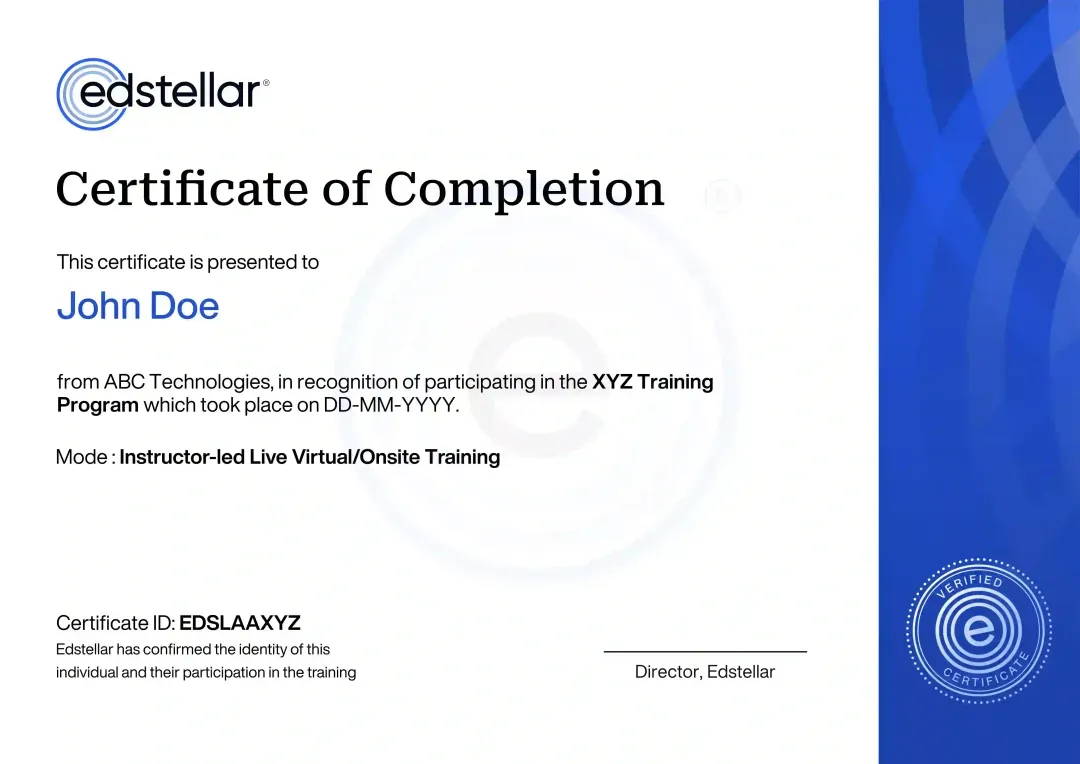
Certificate of Training Completion.
On successful completion, employees receive an Edstellar course completion certificate, recognizing their commitment to ongoing learning and professional development. It validates the skills they have built and motivates them to keep growing and contribute to organizational success.
Earned, not attended. Awarded on completion of all hands-on labs and the capstone project.
Training Delivery Modes: Virtual, Onsite and Hybrid
Instructor-led delivery shaped to your schedule: live virtual for distributed teams, onsite for face-to-face presentation practice, or hybrid for both.
Hybrid Training
A flexible mix of onsite practice sessions and live virtual facilitation, so teams rehearse storytelling together wherever they sit.
- Onsite practice plus remote coaching
- Schedule-friendly across shifts and zones
- Live instructor guidance in every session
- Same scenarios and capstone in all formats

Onsite Training
Delivered at your facility with instructors running live role plays and presentation practice sessions with your team.
- Tailored to your team's real presentations
- Face-to-face practice with instant feedback
- Team-wide alignment in one room
- Scenarios built from your work context

Live Virtual Training
Fully interactive live virtual sessions with breakout rooms, screen sharing, and guided presentation practice.
- Live instructor-led sessions, not recordings
- Breakout rooms for small-group practice
- Screen sharing for design walkthroughs
- Scheduling across time zones

Need a training format that works for your team?
Full days, half days across weeks, or split by module. Tell us the delivery window and we schedule the cohort around it.
Learn from industry experts.
Every session is led by a practitioner who has run monitoring for models in production, not a generalist working from slides.

Yogesh
Graphic Design Trainer in Chennai
13+ years of Experience

Vaishnav
Data Science with Python Trainer in Pune
11+ years of Experience

Shilpi
Power BI Trainer in New
11+ years of Experience

Moinak
Tableau and Data Analytics Trainer in Gurgaon
9+ years of Experience

Saurabh
Data Science with Python Trainer in Mumbai
14+ years of Experience

Yogesh
Data Science Trainer in Bhopal
8+ years of Experience

Ramagopal
Machine Learning Trainer in Thiruvarur
9+ years of Experience
Trainers are matched to your stack and delivery window at scheduling. We confirm your assigned trainer, with a full profile, before the program is booked.
Frequently Asked Questions
Share your team size, roles, and delivery preference and we will return a tailored quote within one business day.
Yes. A discovery call with a training advisor helps us map your team's data communication needs to the curriculum.
Yes. Live virtual sessions run with breakout rooms, screen sharing, and instructor-led role plays and practice scenarios.
Yes. Onsite delivery works well because role plays and the capstone showcase benefit from in-person presentation practice.
The program runs 13 hours, typically across two days or four half-day sessions, matched to your calendar.
Question not answered here?
Put it in the request. A training specialist answers it directly, within one business day.
Where this Training Fits in Your Team's learning path.
Data storytelling comes second, after your team can analyse and visualise data. A story needs sound analysis and clear charts underneath it. Once people can build a data story, the path moves to storytelling for senior audiences and then to using those stories to drive leadership decisions.




Why Choose Edstellar as Your Data Storytelling and Infographic Design Training Provider
Edstellar delivers instructor-led data storytelling training built around your team, your data, and outcomes you can measure.

EXPERT TRAINERS
YEARS DELIVERING
ORGANIZATIONS TRAINED
CERTIFIED
Tailored
Scenarios, role plays, and the capstone are tailored to your team's data, roles, and stakeholder landscape.
Proven Methodology
Training follows a proven story frame, design, deliver, defend arc that turns data into decisions people trust.
Practice-Based Learning
Guided role plays and presentation practice keep teams storytelling aloud throughout the program.
Expert Trainers
Sessions are led by communication practitioners who coach data presentation with teams every week.
Global Scale
Consistent data storytelling programs delivered across regions, time zones, and team sizes.
Measurable Outcomes
Story clarity, visual quality, and showcase scores show exactly what the training delivered.
Also from Edstellar
Talent assessments
Psychometric, behavioral, leadership and 360-degree assessment.
→Training needs analysis
Needs analysis, gap identification, and a training roadmap.
→L&D consulting
Learning strategy, content, technology and ROI measurement.
→OD consulting
Org design, succession planning and cultural change.
→Managed training services
Training outsourcing, vendor management, logistics and administration.
→Coaching solutions
Executive and manager coaching that keeps skills in use.
Start an RFP shaped to your needs.
Answer three quick questions about team size, scope, and how often you need the program run, then send the request from the last step. Everything you choose travels with it, so you only fill this in once.
How many team members need training?
Data Storytelling & Infographic Design Training Packages & Pricing
Where L&D holds an annual budget, license packages price the whole year at once instead of raising a purchase order per workshop. Hours and licenses are pooled across teams, programs and locations, so unused capacity is not stranded in one department.
Starter
120
trainee licenses64 hours of group training
Tailored for SMBs
Growth
320
trainee licenses160 hours of group training
Ideal for growing SMBs
Enterprise
800
trainee licenses400 hours of group training
Designed for large corporations
Custom
Unlimited
trainee licensesDuration set by the rollout
Multi-region and multi-year
Training Packages & Pricing
Choose the training format that works for your team. Pricing is customized based on your requirements, cohort size, and delivery needs.
Request Data Storytelling and Infographic Design Training for Your Team
Tell us about your team, roles, and timelines and we will design a data storytelling program around your presentations.