

Graph Data and Knowledge Graphs Corporate Training
Build graph analytics skills your team can use immediately
This instructor-led program teaches your team to model data as graphs, build knowledge graphs from enterprise sources, and turn network analysis into decisions, with guided hands-on labs in every module.
Instructor-led group trainingVirtual / on-site / off-site10 languagesDelivered inEnglish, Spanish, Mandarin, German, Arabic, Portuguese, Hindi, French, Japanese, Italian100+ countriesWe have delivered inUnited States, United Kingdom, India, Canada, Germany, France, Netherlands, UAE, Saudi Arabia, Singapore, Australia, Japan, Brazil, South Africa and 90+ more countries
How we build a graph-driven team
The Edstellar GRAPH DATA & KNOWLEDGE GRAPHS Capability Model
Diagnose
Map where relationship data hides in your systems today and where multi-hop questions slow decisions.
Standardize
Align on graph models, ontology rules, and query standards across analytics and engineering teams.
Practice
Model, load, query, and analyze graphs in guided hands-on labs on real enterprise datasets.
Measure
Track graph adoption, query performance, and insight outcomes with dashboards tied to business goals.
Scale
Roll out reusable graph templates, pipelines, and dashboards across business units with tested workflows.





Need more than one program?Get a group quote
Trusted as a Leading Corporate Training Provider by
















Program Overview: What is Graph Data and Knowledge Graphs?
Graph Data & Knowledge Graphs is a hands-on program for data teams that need to model and query connected data. It covers graph thinking and data modeling, graph databases and query languages, building knowledge graphs from enterprise data, graph algorithms for analysis, and insight storytelling with graph dashboards. Participants build working graphs in labs throughout.
Training is lab-first: participants model connected domains, write graph queries, and assemble knowledge graphs from messy enterprise datasets. Instructors with graph data experience review their models and coach them on the design choices that keep graphs fast and useful. Algorithm sessions turn graph structure into analytical insight. The program closes with a capstone end-to-end knowledge graph build on a realistic business domain.
Relational tables flatten relationships that are the whole point of the data: fraud rings, supply chains, customer journeys. Teams stuck in tables miss the connections their competitors see. This program teaches them to think and query in graphs.
The capstone is an end-to-end knowledge graph build: participants take a messy enterprise dataset, model it as a graph, load it into a graph database, write the queries that answer real business questions, and present findings through a graph dashboard. Instructors judge the build on model quality and the insight it produces. Participants leave with a working knowledge graph and the skills to build the next one.
Edstellar delivers this program as instructor-led training in hybrid, onsite, or live virtual formats, shaped around your team's stack. Content adapts to your data sources and BI tools, so every lab mirrors the graph work your analysts and engineers own. Your team learns to design ontologies, resolve entities, run centrality and community analysis, and publish clear network story dashboards. By the end, participants can ship knowledge graphs that answer multi-hop questions flat reports cannot.
What's Included in this Workshop for Your Enterprise Teams
- 1
Graph data modeling
Property graphs, RDF, and ontology design.
- 2
Graph querying
Traversals and multi-hop pattern queries.
- 3
Knowledge graph builds
Entity resolution and ETL pipelines.
- 4
Graph algorithms
Centrality, communities, and path analysis.
- 5
Insight storytelling
Graph dashboards that guide decisions.
- Instructor-led sessions with a graph practitioner
- Hybrid, onsite, or live virtual delivery
- Guided hands-on labs in every module
- Graph lab environments and workbooks included
- Skills assessment and completion summary
- Post-training support for your team
Build your team's skills. Anywhere in the world.
Real-world use cases
from day one
Instructor-led training
for your teams
Delivered globally
in 100+ countries


Enterprise Training Solutions Customized for Your Company
One partner for instructor-led corporate training, delivered the way your teams work.
Request a Training Quote- Customized Training Delivery
- Scale Your Training: Small to Large Teams
- In-person Onsite, Live Virtual or Hybrid Training Modes
- Plan from 2000+ Industry-ready Training Programs
- Hands-On Labs on Live Infrastructure, Led by Industry Experts
Graph Data and Knowledge Graphs Course Topics and Program Outline
Six modules take your team from graph data foundations to a shipped, decision-ready knowledge graph.
Built by Edstellar with graph data and knowledge graph expertise
Built by practitioners who design knowledge graphs and graph analytics in production, shaped around your stack and use cases.
We review your team's data sources, analytics maturity, and graph use cases to shape every lab.
Instructor-led sessions cover graph models, ontologies, and query languages with live demos.
Guided hands-on labs on real datasets: graph builds, traversals, algorithms, and dashboards.
Your team ships a capstone knowledge graph that answers questions flat reports cannot.
Your team leaves with a working knowledge graph and the skills to grow it with new data.
Delivered as
Delivered as instructor-led training in hybrid, onsite, or live virtual formats, scheduled around your team's working hours.

Model a business domain as nodes and edges, then validate the ontology with sample queries.
learna)Property graph versus RDF models
b)Nodes, edges, labels, and properties
c)Designing a domain ontology
d)Spotting graph-shaped business questions
Load a dataset into a graph database and write traversals that answer multi-hop business questions.
learna)Graph database landscape
b)Querying with Cypher-style languages
c)Pattern matching and traversals
d)Loading flat data into a graph
Build an ETL pipeline that merges two source systems into one clean, queryable knowledge graph.
practicea)Entity resolution and identity
b)Mapping relational sources to graphs
c)ETL pipelines for graph loads
d)Data quality checks for graphs
e)Versioning and refresh strategies
Run centrality and community detection to surface influencers and segments in a network dataset.
practicea)Centrality and influence scoring
b)Community detection
c)Shortest paths and routing
d)Link prediction basics
e)Running algorithms in-graph
Build an interactive dashboard that tells a clear story with graph metrics, drill-downs, and comparisons.
applya)Narrative structure for network insights
b)Visual encodings for graph data
c)Interactive graph dashboards
d)Combining graph and tabular metrics
e)Stakeholder-ready storytelling
Ship a complete knowledge graph with queries, analytics, and a stakeholder dashboard for review.
applya)Capstone scope and data preparation
b)Full graph build and query layer
c)Analytics and dashboard delivery
d)Review and handover playbook
Customize this program tailored to your team?
Tell us your training needs: what your team already works with, the level they’re at, and the topics you want them to focus on. We’ll adjust the modules, duration and hands-on labs, and send you a customized outline for your group.
Key Skills and Outcomes Your Team Will Gain
Practical graph skills your analysts and engineers apply to relationship data from day one.
Model data as graphs and design ontologies
Capture relationships as nodes, edges, and labels with a clean ontology.
Query graphs with traversal languages
Write multi-hop queries that answer questions flat reports cannot.
Build knowledge graphs from enterprise data
Resolve entities and run ETL pipelines into a queryable graph.
Run graph algorithms for analysis
Score influence, detect communities, and analyze paths in networks.
Design insight stories with graph data
Structure network findings into narratives stakeholders act on.
Ship interactive graph dashboards
Publish dashboards that blend graph and tabular metrics with drill-downs.
Maintain and refresh knowledge graphs
Version, refresh, and hand over graphs that stay accurate over time.
Teams that Benefit from this Graph Data and Knowledge Graphs Group Training
Built for analysts, engineers, and product teams who work with relationship data. Content adapts to each role and experience level, so every cohort practices the workflows it owns.
Relationship insight your analysts can act on
Help analysts and BI teams answer multi-hop questions, segment networks, and build graph dashboards that drive decisions.
Workflow friction
- Flat, relationship-blind dashboards
- Slow manual network analysis
- Scattered identity data
How the program helps
- Richer network-aware reporting
- Faster relationship analysis
- Trustworthy graph metrics
Practice use cases
- graph dashboards
- network segmentation
- relationship queries
Graph pipelines your engineers can run
Help data engineers build and maintain graph ETL pipelines, entity resolution, and refresh workflows in production.
Workflow friction
- Fragile one-off graph loads
- Duplicate entity records
- Stale relationship data
How the program helps
- Reliable graph ETL pipelines
- Clean resolved entities
- Repeatable graph refreshes
Practice use cases
- graph etl
- entity resolution
- pipeline automation
Network insight your product team can use
Help product and strategy teams explore user and market relationships, test hypotheses, and prioritize with graph evidence.
Workflow friction
- Anecdotal relationship claims
- Hidden network effects
- Slow insight turnaround
How the program helps
- Evidence-backed prioritization
- Clearer user network insight
- Faster hypothesis testing
Practice use cases
- network analysis
- hypothesis testing
- market graphs
Storytelling your marketers can scale
Help marketing teams turn graph insights into clear stories, segment audiences by network behavior, and measure influence.
Workflow friction
- Generic audience segments
- Flat campaign reporting
- Unclear influencer impact
How the program helps
- Compelling insight stories
- Network-based segmentation
- Measurable influence tracking
Practice use cases
- audience segmentation
- influence scoring
- insight storytelling
Cohorts can mix roles or focus on one function; labs adapt to your team's tools and data.
Prerequisites: This program benefits analysts, data engineers, product managers, and marketers who work with relationship data. Basic SQL or BI experience helps, but is not required. No prior graph database experience is needed. Content adapts to each cohort's data sources, tools, and business questions.
Analyst to Knowledge Graph Lead
A role-based path from graph fundamentals to leading knowledge graph projects across the business.
A learning path that grows with analytics careers, from graph basics to confident knowledge graph ownership.
Mixed cohort, or several teams at once?
We can tailor the training to different teams, roles, and experience levels within the same program.
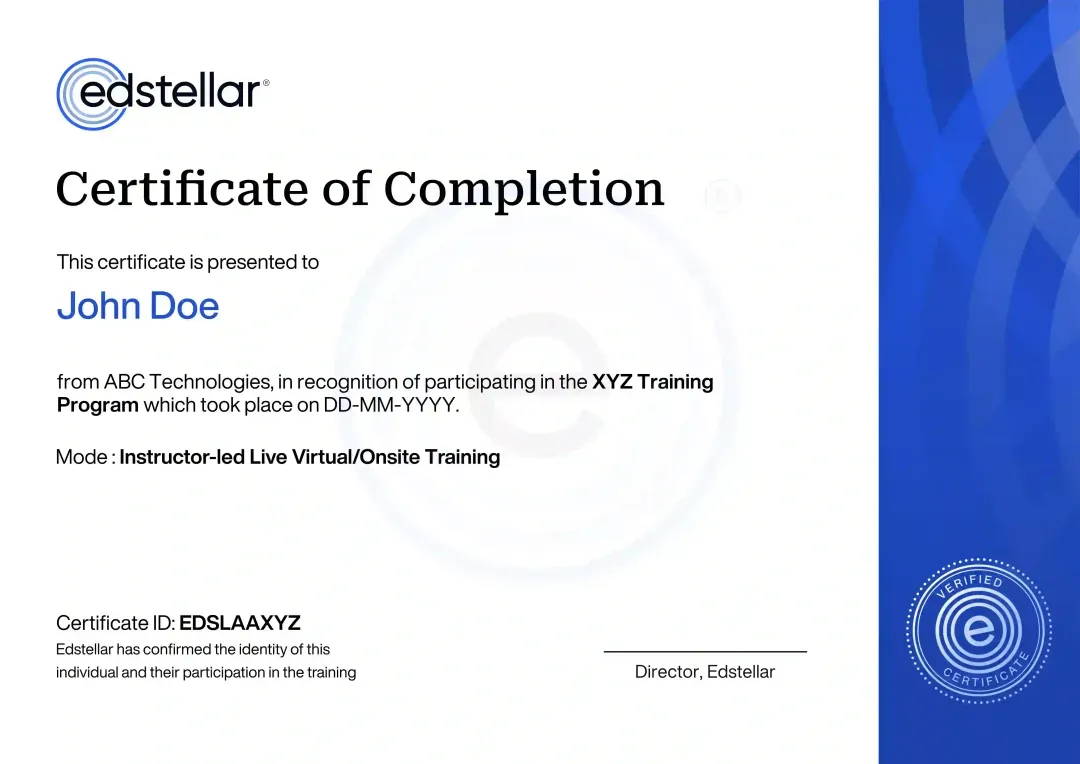
Certificate of Training Completion.
On successful completion, employees receive an Edstellar course completion certificate, recognizing their commitment to ongoing learning and professional development. It validates the skills they have built and motivates them to keep growing and contribute to organizational success.
Earned, not attended. Awarded on completion of all hands-on labs and the capstone project.
Training Delivery Modes: Virtual, Onsite and Hybrid
Choose the format that fits your teams and schedules. Every mode is instructor-led with guided hands-on labs.
Hybrid Training
Blend onsite and live virtual sessions so distributed teams learn together with one instructor and shared labs.
- Mixed onsite and virtual cohorts
- Shared cloud lab environments
- One instructor across sessions
- Flexible scheduling by module

Onsite Training
Bring the instructor to your office for focused, team-based sessions with your data and your stack in the room.
- Instructor at your location
- Team-based lab collaboration
- Labs on your own data
- Customized onsite agenda

Live Virtual Training
Join live online sessions with real-time instructor guidance, screen sharing, and cloud lab environments.
- Live instructor-led sessions
- Real-time Q&A and coaching
- Cloud-based lab access
- Recordings for review

Need a training format that works for your team?
Full days, half days across weeks, or split by module. Tell us the delivery window and we schedule the cohort around it.
Frequently Asked Questions
Share your team size, preferred dates, and delivery mode, and we will send a tailored quote within one business day.
Yes. A short call helps us map your data sources and goals so the program is tailored before we finalize the plan.
Yes. Choose live virtual, onsite, or hybrid delivery; every mode is instructor-led with guided hands-on labs.
Yes. Onsite delivery works well for teams that want labs run on their own data and systems.
The program runs 24 hours, typically across three to four days, with guided labs in every module.
Question not answered here?
Put it in the request. A training specialist answers it directly, within one business day.
Where this Training Fits in Your Team's learning path.
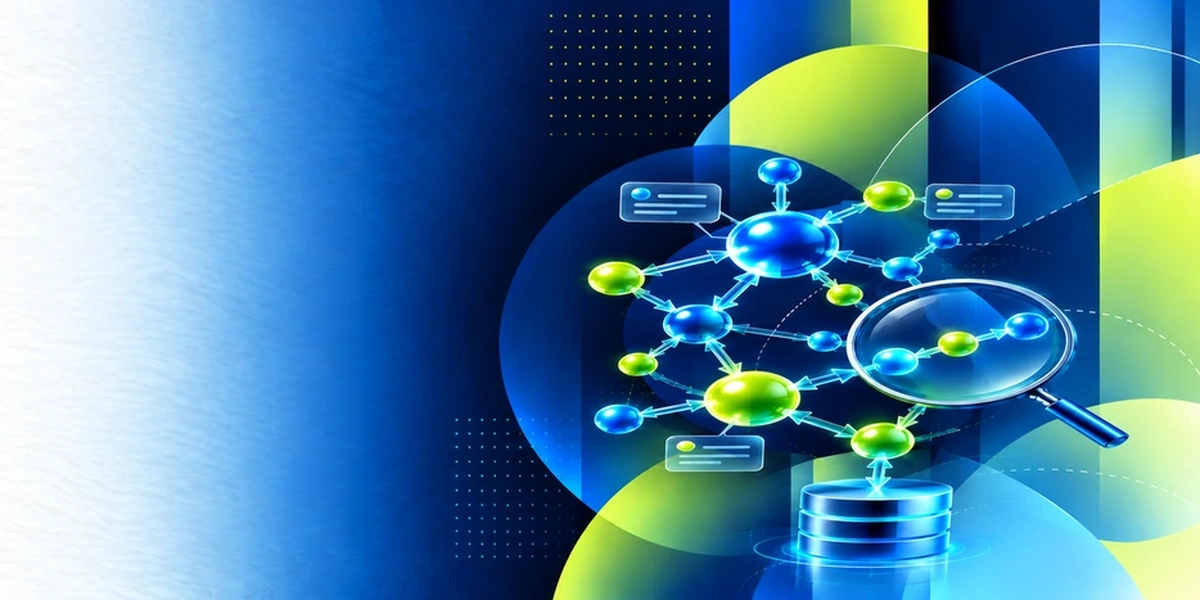
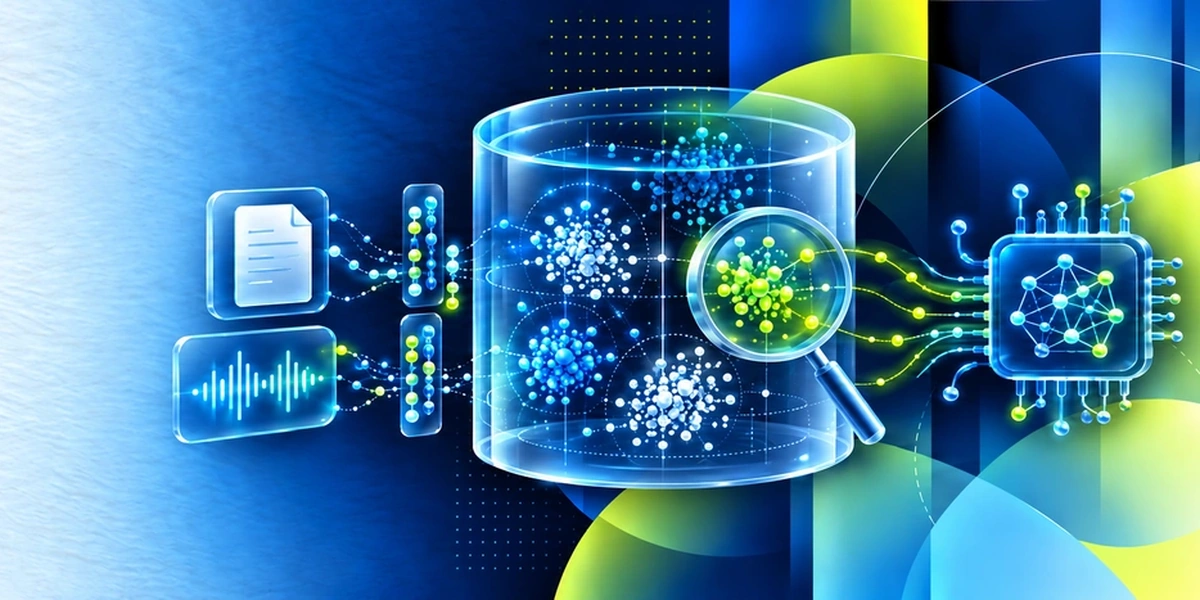
Knowledge graphs build on SQL because your team should understand relational data before modelling it as nodes and relationships. Once the graph concepts are clear, Neo4j puts them into practice, and vector databases add similarity search for AI uses.


Why Choose Edstellar as Your Graph Data and Knowledge Graphs Training Provider
Edstellar delivers graph data training built around your relationship data, your tools, and your team's goals.
EXPERT TRAINERS
YEARS DELIVERING
ORGANIZATIONS TRAINED
CERTIFIED
Tailored
Content adapts to your graph use cases, data sources, and tools, so every lab mirrors the relationship work your team owns.
Proven Methodology
A structured path from graph modeling to shipped dashboards keeps every cohort progressing with measurable checkpoints.
Practice-Based Learning
Guided hands-on labs in every module mean your team models, queries, and analyzes graphs instead of just watching.
Expert Trainers
Practitioners who build knowledge graphs in production lead every session and coach your team through real builds.
Global Scale
We deliver the same tailored program across your sites and time zones with consistent quality and local relevance.
Measurable Outcomes
Skills assessments and a completion summary show exactly what your team can model, query, and ship after training.
Build Knowledge Graphs That Connect Relationship Models With Analytical Questions
Edstellar develops graph-data capability through a complete business-domain case. Participants model entities and relationships, query multi-hop connections, and integrate sources before applying network algorithms and building dashboards. The final knowledge graph is reviewed for modeling consistency, useful traversal behavior, data integration quality, and the evidence supporting its analytical story.
- Step 01
Consult
We explore questions that depend on relationships across data, identifying gaps in graph modeling, source integration, or interpretation and checking the cohort's SQL or BI familiarity.
- Step 02
Plan
Graph thinking and ontology design lead into databases and queries, enterprise-data integration, network algorithms, and storytelling before the complete knowledge graph build.
- Step 03
Align
We align graph-data expertise with analyst, engineering, and business roles, confirming appropriate tools and providing foundations for participants without previous graph database experience.
- Step 04
Customize
Sample entities, relationships, and source-system records reflect familiar domains, allowing ontology and traversal comparisons without exposing confidential customer networks or business relationships.
- Step 05
Execute
Participants merge sources, write multi-hop queries, and compare centrality and communities, receiving feedback on relationship meaning, integration logic, algorithm interpretation, and dashboard clarity.
- Step 06
Evaluate
We assess the knowledge graph for coherent entities and relationships, reproducible integration, queries that answer the stated questions, and analytical conclusions supported by graph evidence.
Also from Edstellar
Talent assessments
Psychometric, behavioral, leadership and 360-degree assessment.
→Training needs analysis
Needs analysis, gap identification, and a training roadmap.
→L&D consulting
Learning strategy, content, technology and ROI measurement.
→OD consulting
Org design, succession planning and cultural change.
→Managed training services
Training outsourcing, vendor management, logistics and administration.
→Coaching solutions
Executive and manager coaching that keeps skills in use.
Start an RFP shaped to your needs.
Answer three quick questions about team size, scope, and how often you need the program run, then send the request from the last step. Everything you choose travels with it, so you only fill this in once.
How many team members need training?
Graph Data & Knowledge Graphs Training Training Packages & Pricing
Where L&D holds an annual budget, license packages price the whole year at once instead of raising a purchase order per workshop. Hours and licenses are pooled across teams, programs and locations, so unused capacity is not stranded in one department.
Starter
120
trainee licenses64 hours of group training
Tailored for SMBs
Growth
320
trainee licenses160 hours of group training
Ideal for growing SMBs
Enterprise
800
trainee licenses400 hours of group training
Designed for large corporations
Custom
Unlimited
trainee licensesDuration set by the rollout
Multi-region and multi-year
Training Packages & Pricing
Choose the training format that works for your team. Pricing is customized based on your requirements, cohort size, and delivery needs.
Request Graph Data and Knowledge Graphs Training for Your Team
Tell us about your team, your data sources, and your preferred dates. We will tailor the program and confirm your schedule and trainer.