

Infrastructure Monitoring (Nagios, Zabbix, Prometheus) Corporate Training
Learn to deploy, configure, and operate Nagios, Zabbix, and Prometheus in live guided labs with expert instructors.
Master infrastructure monitoring with instructor-led labs covering Nagios checks, Zabbix templates, Prometheus queries, and unified alerting.
Instructor-led group trainingVirtual / on-site / off-site10 languagesDelivered inEnglish, Spanish, Mandarin, German, Arabic, Portuguese, Hindi, French, Japanese, Italian100+ countriesWe have delivered inUnited States, United Kingdom, India, Canada, Germany, France, Netherlands, UAE, Saudi Arabia, Singapore, Australia, Japan, Brazil, South Africa and 90+ more countries
How we build a reliable monitoring practice team
THE EDSTELLAR IT INFRASTRUCTURE CAPABILITY MODEL
Assess monitoring maturity
Skill checks map your team's baseline, from Nagios comfort to PromQL practice.
Standardize coverage
Teams align on checks, templates, and alert rules across every critical system.
Practice in guided labs
Hands-on labs on Nagios, Zabbix, and Prometheus build repeatable operational skill.
Measure alert quality
Alert paths are tested and noise is tuned until every signal earns attention.
Scale the practice
Runbooks and templates spread working monitoring patterns across your estate.





Need more than one program?Get a group quote
Trusted as a Leading Corporate Training Provider by
















Program Overview: What is Infrastructure Monitoring (Nagios, Zabbix, Prometheus)?
Infrastructure Monitoring (Nagios, Zabbix, Prometheus) is a 24-hour corporate training program for systems administrators, NOC engineers, and DevOps teams. It covers monitoring foundations, Nagios setup and configuration, Zabbix servers and templates, Prometheus with exporters and alerting, and unified monitoring with incident flow. All three tools get full lab environments.
Training is operations-heavy from the start. Participants install and configure Nagios, deploy Zabbix with agents and templates, stand up Prometheus with exporters, and wire alerting into incident flow. Instructors break things on purpose and grade the response, coaching teams on alert discipline. Each lab is validated against real failure scenarios before moving on. The program closes with a capstone: a monitoring build with formal sign-off.
Blind infrastructure fails loudly: outages discovered by customers, alert storms nobody trusts, and dashboards that miss the real problem. This program builds teams whose monitoring catches failures first, so incidents are short, alerts are trusted, and on-call is sane. See everything, page only when it matters.
The capstone is a monitoring build with sign-off. Each team stands up monitoring for a realistic infrastructure estate: Nagios for legacy checks, Zabbix for agent-based depth, Prometheus for metrics and alerting, all feeding one incident flow. Then the instructors inject failures and the team must detect, triage, and resolve under the clock. Sign-off is earned only when the estate is fully observable and the alerting is trustworthy: a monitoring setup the NOC would accept on night shift.
Learners install and configure Nagios Core with plugins and notifications, deploy Zabbix servers and agents with templates and triggers, and run Prometheus with exporters, PromQL, and Alertmanager routing. The program closes with a capstone where each team designs, deploys, and validates a complete enterprise monitoring stack and hands over a finished runbook.
What's Included in this Workshop for Your Enterprise Teams
- 1
Nagios configuration
Install, check, and notify.
- 2
Zabbix deployment
Monitor with templates.
- 3
Prometheus queries
Scrape and alert.
- 4
Unified alerting
Route every signal.
- 5
Capstone build
Ship a working stack.
- Instructor-led delivery, onsite or virtual
- Guided hands-on labs on live systems
- Lab guides and configuration templates
- PromQL and plugin reference sheets
- Runbook templates for handover
- Post-program support resources
Build your team's skills. Anywhere in the world.
Real-world use cases
from day one
Instructor-led training
for your teams
Delivered globally
in 100+ countries


Enterprise Training Solutions Customized for Your Company
One partner for instructor-led corporate training, delivered the way your teams work.
Request a Training Quote- Customized Training Delivery
- Scale Your Training: Small to Large Teams
- In-person Onsite, Live Virtual or Hybrid Training Modes
- Plan from 2000+ Industry-ready Training Programs
- Hands-On Labs on Live Infrastructure, Led by Industry Experts
Infrastructure Monitoring (Nagios, Zabbix, Prometheus) Course Topics and Program Outline
A tailored 24-hour, six-module workshop: one learning journey from monitoring foundations to a unified capstone build.
Built by Edstellar with infrastructure monitoring practitioners
Built by engineers who run Nagios, Zabbix, and Prometheus stacks in production, shaped around your stack and use cases.
Skill checks map your team's monitoring baseline, from Nagios comfort to PromQL practice, so labs start at the right level.
Instructor-led sessions cover Nagios, Zabbix, and Prometheus architecture with live demos on real lab infrastructure.
Guided labs build hands-on skill: Nagios checks, Zabbix templates, Prometheus queries, and Alertmanager routing.
Teams apply everything in a capstone: a unified monitoring build with validated alerts and a finished runbook.
From monitoring foundations to a unified capstone build, every lab runs on live systems.
Delivered as
Delivered as a hybrid program of live instruction and guided labs, scheduled around your team's operations.

Map observability pillars to a sample server estate and select the right tool for each signal.
learna)Observability pillars: metrics, logs, traces
b)Nagios vs Zabbix vs Prometheus architectures
c)Defining SLOs, SLIs, and alert thresholds
d)Monitoring strategy for servers and services
Install Nagios Core, add hosts with NRPE checks, and verify a notification fires on a failed check.
learna)Nagios Core installation and verification
b)Host, service, and contact configuration
c)NRPE and NCPA plugin checks
d)Notification and escalation rules
Deploy Zabbix server and agents, apply templates, and build triggers that catch CPU and disk pressure.
practicea)Zabbix server installation and database setup
b)Agent deployment and SNMP monitoring
c)Templates, triggers, and host prototypes
d)Dashboards, maps, and maintenance windows
Scrape lab targets with exporters, write PromQL alerts, and route them through Alertmanager to a receiver.
practicea)Prometheus installation and service discovery
b)Node, Blackbox, and Windows exporters
c)PromQL queries, recording rules, and functions
d)Alertmanager routing, silences, and receivers
Build one alert pipeline that deduplicates events from all three tools and opens tickets with severity.
applya)Aggregating Nagios, Zabbix, and Prometheus data
b)Alert deduplication and routing design
c)Ticketing and on-call tool integration
d)Escalation policies and runbook authoring
Design, deploy, and defend a full monitoring stack covering servers, network gear, and services, with a signed-off runbook.
applya)Requirements and architecture design
b)Full stack deployment and validation
c)Alert path testing and false-positive tuning
d)Runbook and handover documentation
Customize this program tailored to your team?
Tell us your training needs: what your team already works with, the level they’re at, and the topics you want them to focus on. We’ll adjust the modules, duration and hands-on labs, and send you a customized outline for your group.
Key Skills and Outcomes Your Team Will Gain
Seven job-ready outcomes your team will demonstrate by the end of the program.
Deploy Nagios monitoring
Install and configure Nagios Core with hosts, services, and notifications.
Deploy Zabbix monitoring
Deploy server and agents, then monitor with templates and triggers.
Query metrics in PromQL
Write PromQL queries and recording rules for metrics analysis.
Route alerts with care
Configure Alertmanager routing, silences, and on-call escalation.
Integrate ticketing tools
Connect monitoring alerts to ticketing and on-call workflows.
Tune alert thresholds
Reduce noise with calibrated thresholds and dedup rules.
Write monitoring runbooks
Document response steps for the incidents teams own.
Teams that Benefit from this Infrastructure Monitoring (Nagios, Zabbix, Prometheus) Group Training
This group training is built for infrastructure teams who own monitoring and uptime. Content adapts to each cohort's tools and experience so every team practices the workflows it owns.
Keep server estates healthy with reliable monitoring.
Infrastructure teams standardize Nagios and Zabbix coverage across servers so outages are caught before users notice.
Workflow friction
- Tool sprawl across monitoring silos
- Noisy alerts that hide real incidents
- Undocumented escalation ownership
How the program helps
- Standardize host and service checks
- Cut alert noise with smart thresholds
- Prove coverage for every critical server
Practice use cases
- nagios check rollout
- zabbix template design
- escalation mapping
Watch every link, device, and circuit proactively.
Network engineers use SNMP monitoring and Prometheus exporters to track device health, links, and latency in one view.
Workflow friction
- Blind spots on legacy devices
- Trap floods during big events
- Manual polling misses short spikes
How the program helps
- Monitor switches and routers via SNMP
- Track link latency and packet loss
- Alert before circuits degrade badly
Practice use cases
- snmp device monitoring
- link latency tracking
- trap storm tuning
Turn monitoring into faster incident response.
SRE teams build PromQL dashboards and Alertmanager routing so the right responder gets a clean signal every time.
Workflow friction
- Dashboards nobody trusts or uses
- Alerts routed to the wrong queue
- SLOs defined but never measured
How the program helps
- Build PromQL service dashboards
- Route alerts to the right responder
- Track SLOs with recording rules
Practice use cases
- promql dashboard design
- alert routing rules
- slo tracking setup
Cohorts train as a cross-functional workforce, with each small group aligned on shared monitoring runbooks.
Prerequisites: This program benefits infrastructure engineers, network operations staff, and SRE teams who own monitoring and incident response. Familiarity with Linux servers and basic networking helps but is not required, and no prior Prometheus or Zabbix experience is needed. The curriculum adapts to each cohort's tools and monitoring maturity.
Infrastructure Engineer to Monitoring Specialist
Tracks how engineers progress from basic monitoring setup to advanced unified alerting through guided practice.
A program that grows with infrastructure careers, from first monitoring setup to confident unified practice.
Mixed cohort, or several teams at once?
We can tailor the training to different teams, roles, and experience levels within the same program.
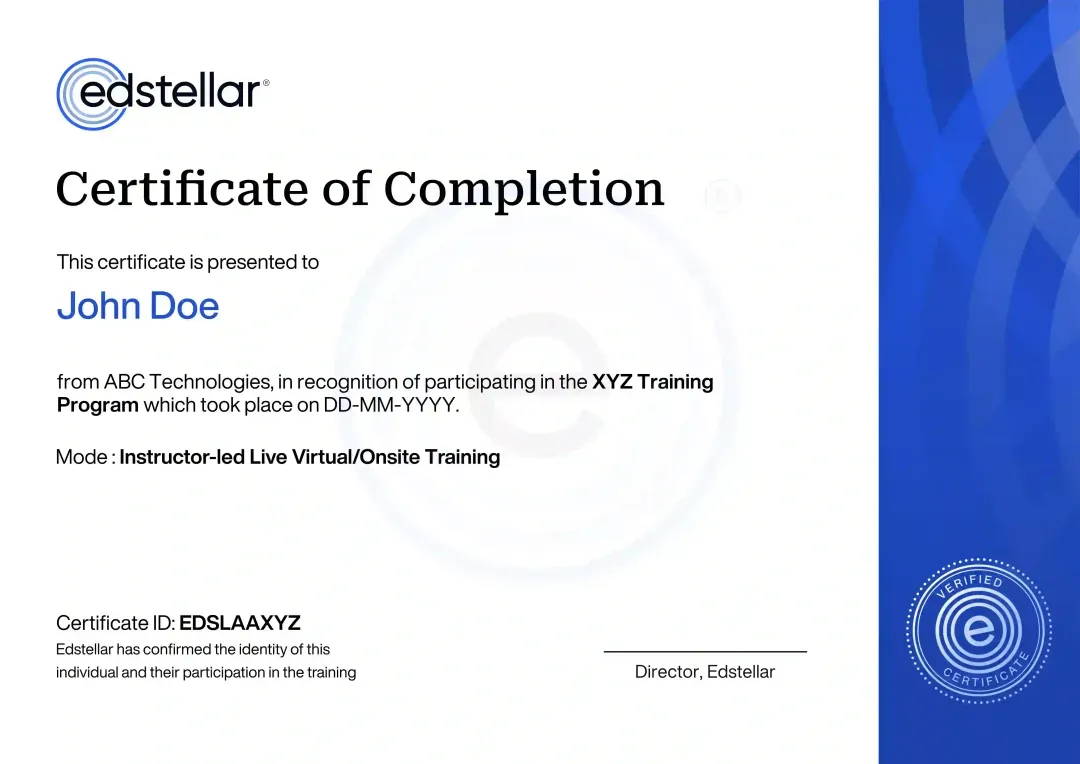
Certificate of Training Completion.
On successful completion, employees receive an Edstellar course completion certificate, recognizing their commitment to ongoing learning and professional development. It validates the skills they have built and motivates them to keep growing and contribute to organizational success.
Earned, not attended. Awarded on completion of all hands-on labs and the capstone project.
Training Delivery Modes: Virtual, Onsite and Hybrid
Choose the delivery mode that fits your team's schedule and operations, with the same guided labs in every format.
Hybrid Training
Instructor-led sessions blend onsite and virtual delivery with guided labs, scheduled around your team's operations and on-call rotations.
- Mix onsite and virtual sessions
- Labs scheduled around on-call shifts
- Live instructor support throughout
- Recordings and lab guides included

Onsite Training
Delivered at your office or data center, with lab systems on your network and instructors working alongside your team.
- Delivered at your office
- Labs on your own network
- Direct access to your tooling
- Team workshops in person

Live Virtual Training
Live virtual instructor-led sessions with remote lab access, breakout support, and the same hands-on exercises as onsite.
- Live instructor-led online
- Remote access to lab systems
- Breakout rooms for practice
- Same labs as onsite delivery

Need a training format that works for your team?
Full days, half days across weeks, or split by module. Tell us the delivery window and we schedule the cohort around it.
Frequently Asked Questions
Share your team size, tooling mix, and timelines. We respond with a tailored quote and plan.
Yes. A short call maps your monitoring stack and goals before we finalize the curriculum.
Yes. Live virtual sessions include the same guided labs as onsite, with instructor support.
Yes. Onsite delivery runs in your office or data center, scheduled around your operations.
The program runs 24 instructor-led hours across six modules, usually over three to four days.
Question not answered here?
Put it in the request. A training specialist answers it directly, within one business day.
Where this Training Fits in Your Team's learning path.
Infrastructure monitoring comes after Linux administration because your team needs to know the systems before choosing what to watch. Grafana then makes the metrics readable, and SRE turns monitoring into service levels and incident practice.




Why Choose Edstellar as Your Monitoring (Nagios, Zabbix, Prometheus) Training Provider
When comparing providers, Edstellar is the training partner that pairs expert instruction with hands-on Nagios, Zabbix, and Prometheus labs tuned to your estate.

EXPERT TRAINERS
YEARS DELIVERING
ORGANIZATIONS TRAINED
CERTIFIED
Tailored
Every cohort's labs are tuned to your Nagios, Zabbix, and Prometheus versions and monitoring targets.
Proven Methodology
We diagnose your baseline, standardize coverage, practice in labs, measure skills, and scale the wins.
Practice-Based Learning
Teams learn by doing: guided labs on live monitoring stacks, not slides, build real operational skill.
Expert Trainers
Instructors run monitoring stacks in production and bring real alert-tuning experience to every session.
Global Scale
We deliver consistent monitoring training across regions, time zones, and distributed infrastructure teams.
Measurable Outcomes
Skill checks and a validated capstone prove your team can deploy, alert, and respond with confidence.
Turn Infrastructure Signals Into Tested Monitoring and Incident Workflows
Edstellar connects Nagios, Zabbix, and Prometheus configuration with the operational decisions that make monitoring useful. Participants build checks, templates, metric queries, and alert routing, then test them against deliberate lab failures. The final monitoring design includes an incident flow and runbook, reviewed for coverage, signal quality, escalation ownership, and response evidence.
- Step 01
Consult
We examine the monitored estate, Linux and networking familiarity, alert noise, and escalation gaps to identify which monitoring and incident workflows need the most practice.
- Step 02
Plan
We begin with signal selection, then build Nagios checks, Zabbix triggers, and Prometheus alerts before combining event deduplication and ticket routing in the capstone.
- Step 03
Align
We align monitoring and operations expertise with infrastructure, network, and SRE duties, confirming lab targets, agents, exporters, and an appropriate test destination for notifications.
- Step 04
Customize
We tailor sample host, device, and service failures to familiar estate patterns, including threshold and routing cases that reveal missed signals or unnecessary escalation.
- Step 05
Execute
Participants configure NRPE checks, Zabbix templates, and PromQL alerts, then respond to injected faults with coaching on thresholds, Alertmanager routing, and severity assignment.
- Step 06
Evaluate
We evaluate the monitoring build and runbook against failure tests, checking detection coverage, duplicate handling, useful ticket information, and clear ownership of the response.
Also from Edstellar
Talent assessments
Psychometric, behavioral, leadership and 360-degree assessment.
→Training needs analysis
Needs analysis, gap identification, and a training roadmap.
→L&D consulting
Learning strategy, content, technology and ROI measurement.
→OD consulting
Org design, succession planning and cultural change.
→Managed training services
Training outsourcing, vendor management, logistics and administration.
→Coaching solutions
Executive and manager coaching that keeps skills in use.
Start an RFP shaped to your needs.
Answer three quick questions about team size, scope, and how often you need the program run, then send the request from the last step. Everything you choose travels with it, so you only fill this in once.
How many team members need training?
Infrastructure Monitoring (Nagios, Zabbix, Prometheus) Training Packages & Pricing
Where L&D holds an annual budget, license packages price the whole year at once instead of raising a purchase order per workshop. Hours and licenses are pooled across teams, programs and locations, so unused capacity is not stranded in one department.
Starter
120
trainee licenses64 hours of group training
Tailored for SMBs
Growth
320
trainee licenses160 hours of group training
Ideal for growing SMBs
Enterprise
800
trainee licenses400 hours of group training
Designed for large corporations
Custom
Unlimited
trainee licensesDuration set by the rollout
Multi-region and multi-year
Training Packages & Pricing
Choose the training format that works for your team. Pricing is customized based on your requirements, cohort size, and delivery needs.
Request Infrastructure Monitoring (Nagios, Zabbix, Prometheus) Training for Your Team
Share your team size, monitoring stack, Nagios/Zabbix/Prometheus versions, and timelines to receive a tailored training plan.