

Grafana Observability Stack Corporate Training
Turn scattered metrics, logs, and traces into your team's single observability command center.
Give your enterprise teams the observability skills that turn telemetry into faster incident response. Edstellar's Grafana Observability Stack corporate training equips your employees with hands-on practice across Grafana, Prometheus, Loki, Tempo, and Mimir: building dashboards, alerts, and SLOs on a cloud stack. This instructor-led program blends onsite and live virtual delivery and is tailored to your team's tools, with outcomes you can report.
Instructor-led group trainingVirtual / on-site / off-site10 languagesDelivered inEnglish, Spanish, Mandarin, German, Arabic, Portuguese, Hindi, French, Japanese, Italian100+ countriesWe have delivered inUnited States, United Kingdom, India, Canada, Germany, France, Netherlands, UAE, Saudi Arabia, Singapore, Australia, Japan, Brazil, South Africa and 90+ more countries
How we build a observability-fluent team
The Edstellar CLOUD Capability Model
Diagnose
We baseline your team's telemetry coverage, finding blind spots across metrics, logs, and traces.
Standardize
Your team adopts one standard for dashboards, alerts, and SLOs, built on proven Grafana practices.
Practice
Guided labs build Grafana dashboards, LogQL queries, Tempo traces, and Mimir alerts on live test stacks.
Measure
Lab reviews and dashboard assessments show your team's observability fluency rising before rollout.
Scale
We roll the program out across cohorts and services, keeping one observability standard everywhere.





Need more than one program?Get a group quote
Trusted as a Leading Corporate Training Provider by
















Program Overview: What is Grafana Observability Stack?
Grafana Observability Stack is a hands-on program for engineers who need to see what their systems are doing before users tell them. It covers observability concepts and setup, metrics with Prometheus and Grafana, log aggregation with Loki, distributed tracing with Tempo, and alerting with SLOs and incident response. Participants build working observability setups in labs throughout.
Training is lab-driven from the first module: participants stand up Prometheus and Grafana, pipe logs into Loki, trace requests through Tempo, and define alerts tied to SLOs. Instructors with production observability experience review their dashboards and coach them on separating signal from noise. Incident response sessions teach teams to go from alert to root cause quickly. The program closes with a capstone full-stack observability build on a realistic service.
Systems fail in the gaps between the metrics nobody watches, and teams without observability debug by guessing. Every outage becomes a war room instead of a dashboard check. This program gives engineers the visibility that turns incidents into routine fixes.
The capstone is a full-stack observability build: participants instrument a realistic service end to end, with metrics in Prometheus, logs in Loki, traces in Tempo, Grafana dashboards that tell the service's story, and SLO-based alerts that fire before users notice. Instructors break the service and grade the detection. Participants leave with a working stack design and the dashboards to prove it.
Observability is how modern teams keep cloud services reliable. This program connects metrics, logs, traces, and profiles into one Grafana workflow, so on-call engineers move from alert to root cause in minutes. Teams leave with reusable dashboards, alert rules, and SLO templates built for their own services.
The program enhances incident response, reduces mean time to resolution, and strengthens the monitoring capability your platform teams depend on every day.
What's Included in this Workshop for Your Enterprise Teams
- 1
Observability concepts primer
Metrics, logs, and traces explained simply.
- 2
Guided Grafana lab environment
Prebuilt stack with Prometheus, Loki, and Tempo ready.
- 3
Dashboard and alert build-outs
Build dashboards, alerts, and SLO panels hands-on.
- 4
Technical skills assessment
Lab-based checks measure progress against program goals.
- 5
Workbook and templates
Reusable dashboard and alert templates for daily work.
- Training delivered at any of your offices globally
- 10+ languages
- Schedule around your calendar
- Group size set along with you
- Run as one cohort or split into batches
- Recurring and annual options
- Trainer sourcing, matching and logistics
- Instructor-led (virtual/onsite/hybrid)
Build your team's skills. Anywhere in the world.
Real-world use cases
from day one
Instructor-led training
for your teams
Delivered globally
in 100+ countries


Enterprise Training Solutions Customized for Your Company
One partner for instructor-led corporate training, delivered the way your teams work.
Request a Training Quote- Customized Training Delivery
- Scale Your Training: Small to Large Teams
- In-person Onsite, Live Virtual or Hybrid Training Modes
- Plan from 2000+ Industry-ready Training Programs
- Hands-On Labs on Live Infrastructure, Led by Industry Experts
Grafana Observability Stack Course Topics and Program Outline
Six modules take your team from observability foundations to a production-ready Grafana stack: metrics, logs, traces, alerting, and a capstone build. Every module pairs concept briefings with guided hands-on labs on a live test environment.
Built by Edstellar with observability practitioners
Built by engineers who run Grafana stacks in production, shaped around your stack and use cases.
A short skills check maps your team's Grafana baseline before module one, so labs start at the right level.
Instructor-led sessions build Grafana, Prometheus, and telemetry foundations over 6 hours of concept work.
Guided labs across 8.5 hours put dashboards, LogQL, and Tempo traces in your team's hands with live troubleshooting.
Your team ships alerting, SLOs, and a full-stack capstone build over 9.5 hours of applied, instructor-reviewed work.
24 hours from first dashboard to a production-ready observability stack
Delivered as
The program runs as instructor-led hybrid training, typically three full days, with pacing and module weighting adjusted to your team's stack and schedule.

Install Grafana, connect Prometheus, and build your first panel.
learna)The four telemetry signals: metrics, logs, traces, profiles
b)Observability versus traditional monitoring
c)Grafana stack architecture overview
d)Installing Grafana and connecting data sources
e)Navigating dashboards, panels, and Explore
Query Prometheus with PromQL and build a templated dashboard.
learna)Prometheus architecture and metric exposition
b)PromQL essentials: selectors, functions, aggregations
c)Building panels, dashboards, and variables
d)Dashboard templating and folder organization
e)Recording rules and metric best practices
Ingest logs into Loki, query with LogQL, and correlate logs with dashboards.
practicea)Loki architecture and log ingestion pipelines
b)LogQL for filtering, parsing, and aggregation
c)Correlating logs with metrics in Grafana
d)Log-based alerts and notification routing
e)Labels, retention, and cardinality control
Instrument services with OpenTelemetry and trace requests end to end in Tempo.
practicea)Trace context and OpenTelemetry instrumentation
b)Deploying and configuring Tempo
c)Trace visualization and the service graph
d)Correlating traces, metrics, and logs
e)Sampling strategies for high-volume services
Build alert rules, SLO dashboards, and a runbook-driven incident drill.
applya)Alert rules, labels, and Alertmanager routing
b)Notification policies, silences, and runbooks
c)Defining SLIs and SLOs in Grafana
d)Error budgets and burn-rate alerting
e)Incident response workflows with dashboards
Deploy the full stack, instrument an app, and ship a production-ready observability package.
applya)Designing the end-to-end observability architecture
b)Deploying the complete Grafana stack
c)Instrumenting a sample cloud application
d)Building the unified dashboard and alert suite
e)Instructor review and production handoff
Customize this program tailored to your team?
Tell us your training needs: what your team already works with, the level they’re at, and the topics you want them to focus on. We’ll adjust the modules, duration and hands-on labs, and send you a customized outline for your group.
Key Skills and Outcomes Your Team Will Gain
Your team will configure, query, and troubleshoot a complete Grafana observability stack, leaving with dashboards, alerts, and SLOs ready for production use.
Navigate the Grafana interface
Move confidently through dashboards, panels, and Explore to inspect metrics, logs, and traces during incidents.
Query metrics with PromQL
Write PromQL selectors, functions, and aggregations to answer performance questions and feed dashboard panels with accurate data.
Query logs with LogQL in Loki
Filter, parse, and aggregate log streams in Loki, then correlate log evidence with metrics when troubleshooting failures.
Trace requests across services
Instrument services with OpenTelemetry and use Tempo traces and service graphs to pinpoint latency and errors in distributed systems.
Design alerts and SLOs
Write alert rules, configure routing and runbooks, and define SLIs, SLOs, and error budgets that guide on-call response.
Correlate telemetry signals
Connect metrics, logs, and traces in Grafana to move from a single alert to verified root cause without switching tools.
Deploy the Grafana stack
Stand up Grafana with Prometheus, Loki, Tempo, and Mimir, and hand over a documented, production-ready configuration.
Teams that Benefit from this Grafana Observability Stack Group Training
Built for cloud, platform, SRE, and NOC teams that keep services reliable. Whether your team is adopting Grafana or standardizing an existing stack, content adapts to role and experience so each cohort practices the workflows it owns.
Faster root cause with one telemetry view
SREs consolidate metrics, logs, and traces in Grafana, cutting the time from alert to root cause. Standard dashboards and SLOs give every on-call shift the same reliable starting point.
Workflow friction
- Alert noise drowns real incidents
- Root cause takes too many tool hops
- Dashboard sprawl confuses on-call shifts
How the program helps
- Tune alerts with routing and runbooks
- Correlate traces, logs, and metrics fast
- Standardize one dashboard per service
Practice use cases
- Alert tuning drills
- Trace correlation hunts
- SLO dashboard builds
- Runbook practice
A standard observability stack for every service
Platform teams provision Grafana with Prometheus, Loki, and Tempo as the default telemetry backbone. Consistent instrumentation and dashboards make every new service observable from day one.
Workflow friction
- Inconsistent instrumentation across services
- Stack configuration drifts between teams
- New services ship without dashboards
How the program helps
- Provision Grafana stacks from templates
- Standardize OpenTelemetry instrumentation
- Ship dashboards with every service
Practice use cases
- Stack provisioning labs
- Instrumentation practice
- Template dashboards
- Config reviews
Release with confidence, roll back with evidence
DevOps engineers tie deployments to telemetry, watching release dashboards and SLOs to catch regressions early. Incident runbooks turn alerts into practiced, repeatable response.
Workflow friction
- Deployments cause surprise incidents
- Pipeline telemetry gaps hide regressions
- Rollback calls lack hard evidence
How the program helps
- Build release dashboards and SLO gates
- Alert on burn rate, not just errors
- Practice runbook-driven incident response
Practice use cases
- Release dashboard labs
- SLO gate drills
- Incident simulations
Triage tickets with logs and dashboards
Support teams use Grafana dashboards and LogQL to triage tickets before escalating. Shared views with engineering cut handoff time and repeat escalations.
Workflow friction
- Ticket triage starts from zero context
- Log spelunking slows every investigation
- Escalations repeat for known issues
How the program helps
- Triage with dashboards and LogQL
- Follow runbooks from alert to fix
- Share one view with engineering
Practice use cases
- Log triage drills
- Dashboard walkthroughs
- Alert response practice
Each cohort works through role-relevant scenarios, then leaves with reusable patterns for day-to-day work.
Prerequisites: This program benefits SREs, platform and DevOps engineers, and NOC teams who operate cloud services. Basic familiarity with cloud concepts and Linux command lines helps, but is not required. No prior Grafana experience is needed: content adapts to each cohort's tools, data sources, and alerting workflows.
Platform Engineer to Observability Lead
The program moves engineers from foundational Grafana skills to advanced, production-ready observability practice across six guided modules.
One program that grows with platform careers, from Grafana basics to confident production practice.
Mixed cohort, or several teams at once?
We can tailor the training to different teams, roles, and experience levels within the same program.
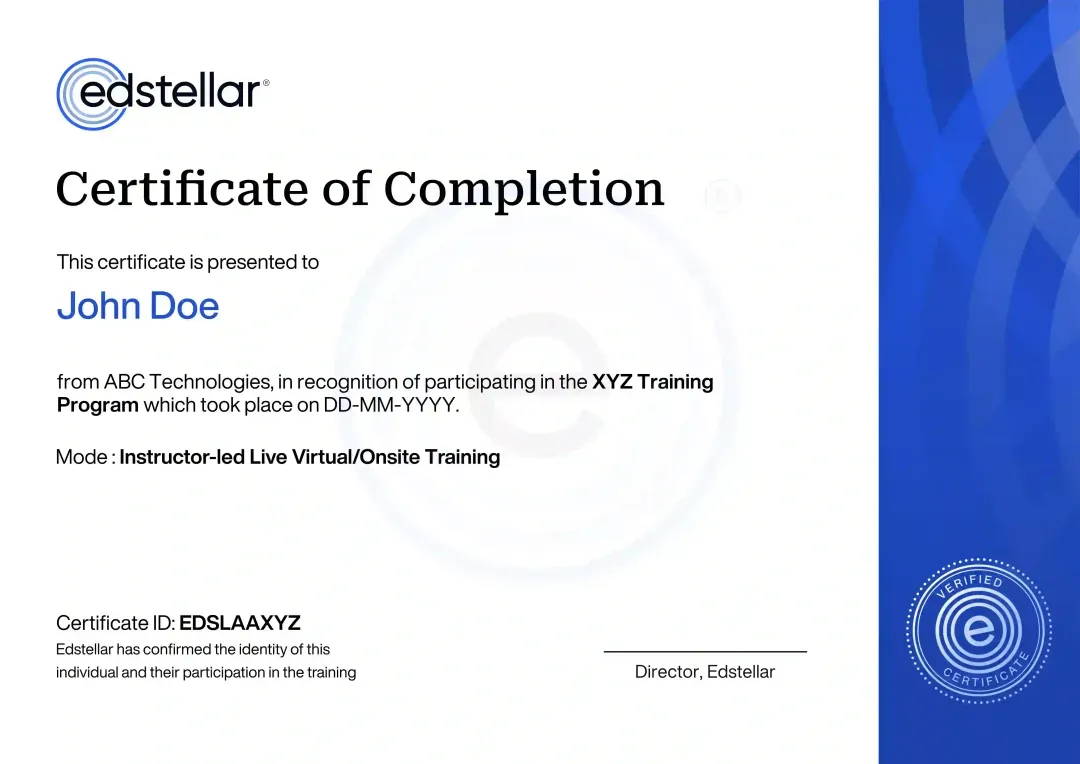
Certificate of Training Completion.
On successful completion, employees receive an Edstellar course completion certificate, recognizing their commitment to ongoing learning and professional development. It validates the skills they have built and motivates them to keep growing and contribute to organizational success.
Earned, not attended. Awarded on completion of all hands-on labs and the capstone project.
Training Delivery Modes: Virtual, Onsite and Hybrid
Every engagement is instructor-led and customized to your team's tools, services, and schedule. Tell us your stack and cohort size, and we will propose the delivery mix that fits your calendar.
Hybrid Training
The standard format for this technical program: instructor-led concept sessions combined with supervised hands-on labs. Your team joins live with an expert trainer guiding every exercise, whether together onsite or connected virtually.
- Instructor-led concept sessions with live demos
- Supervised hands-on labs on a guided Grafana stack
- Mix onsite and live virtual attendance per cohort
- Pacing tuned to your team's stack and schedule

Onsite Sessions
We deliver at your offices, with the lab environment and agenda tuned to your stack. Onsite cohorts get direct trainer support during complex stack builds and troubleshooting exercises.
- Delivered at your offices worldwide
- Direct trainer support during stack builds
- Labs tuned to your data sources and tools
- Cohort exercises matched to your services

Live Virtual Sessions
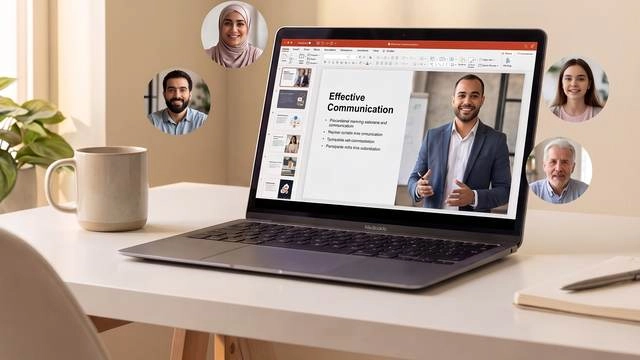
Live virtual delivery runs instructor-led on Zoom or Teams, with breakout rooms for lab work and screen-share reviews. Every participant works in the same guided Grafana environment as an onsite cohort.
- Live instructor-led sessions on Zoom or Teams
- Breakout rooms for guided lab work
- Screen-share reviews of dashboards and alerts
- Same lab environment as onsite cohorts
Need a training format that works for your team?
Full days, half days across weeks, or split by module. Tell us the delivery window and we schedule the cohort around it.
Frequently Asked Questions
Share your team size, preferred dates, and delivery mode in the lead form. We reply with a tailored proposal covering scope, schedule, and pricing.
Yes. Book a short discovery call and we will map your training needs, stack, and timelines before sharing a tailored training plan.
Yes. Live virtual sessions run instructor-led on Zoom or Teams, with guided Grafana labs, breakout exercises, and real-time feedback.
Yes. We deliver onsite at your offices, with the lab environment and exercises adapted to your team's stack and priorities.
The standard program runs 24 hours, typically over three full days. Duration and pacing can be adjusted to fit your schedule.
Question not answered here?
Put it in the request. A training specialist answers it directly, within one business day.
Where this Training Fits in Your Team's learning path.
Grafana sits after infrastructure monitoring because dashboards need metrics to show. OpenTelemetry then adds traces and logs to the same view, and SRE turns those signals into service levels and alerts that matter.

Why Choose Edstellar as Your Grafana Observability Stack Training Provider
Edstellar brings 5+ years of corporate training experience to your observability goals. Your trainers are practitioners matched to your cloud stack, and every program is customized to your services, with lab-based learning and Skills Matrix reporting that shows capability growth.
EXPERT TRAINERS
YEARS DELIVERING
ORGANIZATIONS TRAINED
CERTIFIED
Tailored
Content is shaped around your stack before delivery, so every lab mirrors your real dashboards and alerts.
Proven Methodology
5+ years of corporate training experience delivering technical programs to cloud and platform teams worldwide.
Practice-Based Learning
Your team builds in 5 hands-on labs across 6 modules, shipping dashboards, alerts, and SLOs.
Expert Trainers
Learn from 5,000+ certified trainers matched to your stack, with full profiles shared before you book.
Global Scale
One program delivered worldwide, in hybrid, onsite, or live virtual formats that fit your teams.
Measurable Outcomes
Baseline-to-capstone measurement plus Skills Matrix reporting on your team's Grafana fluency.
Connect Metrics, Logs and Traces Through a Reviewed Grafana Stack
Edstellar develops observability capability by connecting service questions with the telemetry needed to answer them. Participants build Prometheus dashboards, query Loki logs, and trace requests in Tempo before designing SLO-based alerts. The final service investigation is reviewed for signal correlation, actionable alerting, and runbook evidence supporting the diagnosis.
- Step 01
Consult
We explore noisy alerts, incomplete service visibility, and slow diagnosis, checking Linux and cloud familiarity and the operational responsibilities participants bring to observability practice.
- Step 02
Plan
Stack setup leads into Prometheus metrics, Loki logs, Tempo tracing, and SLO-based alerting before the complete application observability build and incident exercise.
- Step 03
Align
We align observability expertise with SRE, DevOps, platform, and NOC roles, confirming suitable practice services, telemetry sources, and time for guided investigation.
- Step 04
Customize
Sample applications and seeded service faults reflect familiar operational questions, allowing dashboard and alert design without exposing sensitive production logs or tracing data.
- Step 05
Execute
Participants write PromQL and LogQL queries, instrument requests, and run incident drills, receiving feedback on telemetry correlation, alert thresholds, SLO interpretation, and diagnostic steps.
- Step 06
Evaluate
We assess the observability package for connected metrics, logs, and traces, useful alerts, and a runbook-supported explanation of the demonstrated service fault.
Also from Edstellar
Talent assessments
Psychometric, behavioral, leadership and 360-degree assessment.
→Training needs analysis
Needs analysis, gap identification, and a training roadmap.
→L&D consulting
Learning strategy, content, technology and ROI measurement.
→OD consulting
Org design, succession planning and cultural change.
→Managed training services
Training outsourcing, vendor management, logistics and administration.
→Coaching solutions
Executive and manager coaching that keeps skills in use.
Start an RFP shaped to your needs.
Answer three quick questions about team size, scope, and how often you need the program run, then send the request from the last step. Everything you choose travels with it, so you only fill this in once.
How many team members need training?
Grafana Observability Stack Training Packages & Pricing
Where L&D holds an annual budget, license packages price the whole year at once instead of raising a purchase order per workshop. Hours and licenses are pooled across teams, programs and locations, so unused capacity is not stranded in one department.
Starter
120
trainee licenses64 hours of group training
Tailored for SMBs
Growth
320
trainee licenses160 hours of group training
Ideal for growing SMBs
Enterprise
800
trainee licenses400 hours of group training
Designed for large corporations
Custom
Unlimited
trainee licensesDuration set by the rollout
Multi-region and multi-year
Training Packages & Pricing
Choose the training format that works for your team. Pricing is customized based on your requirements, cohort size, and delivery needs.
Request Grafana Observability Stack Training for Your Team
Tell us about your team, your cloud stack, and your observability goals. We will arrange a discovery call, tailor the Grafana program to your services, and share a proposal with schedule and pricing.