

Data Visualization with Python and Modern BI Corporate Training
Instructor-led training in Python visualization and modern BI for analytics and business teams.
Master Python, modern BI, dashboard design, and insight storytelling with Edstellar's instructor-led corporate training, a program that builds analytics skills through guided hands-on labs.
Instructor-led group trainingVirtual / on-site / off-site10 languagesDelivered inEnglish, Spanish, Mandarin, German, Arabic, Portuguese, Hindi, French, Japanese, Italian100+ countriesWe have delivered inUnited States, United Kingdom, India, Canada, Germany, France, Netherlands, UAE, Saudi Arabia, Singapore, Australia, Japan, Brazil, South Africa and 90+ more countries
How we build a data-visualization-ready team
The Edstellar ANALYTICS Capability Model
Diagnose
Map your team's current plotting, dashboard, and storytelling skill against the program goals.
Standardize
Agree on chart conventions, color use, and metric definitions before building begins.
Practice
Work through guided labs in Python and BI tools on datasets that mirror your own.
Measure
Score capstone dashboards against readability, accuracy, and narrative clarity.
Scale
Reuse templates and starter dashboards so every new cohort ships consistent visuals.




Need more than one program?Get a group quote
Trusted as a Leading Corporate Training Provider by
















Program Overview: What is Data Visualization with Python and Modern BI?
Data Visualization with Python & Modern BI is an instructor-led corporate training program for teams that need to turn raw data into visuals executives trust. Over 24 hours, participants move from exploratory plots to governed dashboards and executive insight stories, working with Python and modern BI platforms. It covers visual thinking, plotting essentials, interactive dashboards, and data storytelling.
Each module pairs short instruction with guided labs on realistic datasets: teams build plots in Matplotlib and Seaborn, wire interactive dashboards in Plotly, and publish governed reports in modern BI tools. Instructors review every visual, coaching participants through chart selection, dashboard layout, and narrative framing before the cohort advances. Practice builds across the program toward the capstone, an end-to-end analytics showcase. Feedback reflects the team's own data and reporting stack.
Technical teams often produce visuals only they can read: dense notebooks, default charts, and dashboards nobody opens. This program teaches the visual judgment that bridges analysis and decision, so plots communicate and dashboards get used. They return as the team whose charts settle arguments instead of starting them.
The capstone is an end-to-end analytics showcase: each team takes a real dataset from exploration through Python visualization and BI publishing to an executive narrative, delivered live to instructors. The review grades the full chain, from data handling honesty to visual clarity to whether the story drove a recommendation. Graduates take home their showcase, a visualization style guide, and dashboard patterns they can deploy on their next project.
Across 6 modules, learners progress from visual-thinking foundations and Python plotting to interactive Plotly dashboards, modern BI modeling and publishing, and data storytelling. Guided labs use realistic datasets, and the capstone pairs a Python analysis, a published BI dashboard, and a narrated insight story for instructor review.
What's Included in this Workshop for Your Enterprise Teams
- 1
Foundation modules
Visual thinking and Python plotting essentials.
- 2
Practice modules
Interactive dashboards and modern BI workflows.
- 3
Application modules
Storytelling labs and a full capstone build.
- Instructor-led sessions, virtual or onsite
- Guided hands-on labs with datasets
- Reusable Python and dashboard templates
- Module checkpoints and instructor feedback
- Capstone build and showcase review
- Post-program lab guide access
Build your team's skills. Anywhere in the world.
Real-world use cases
from day one
Instructor-led training
for your teams
Delivered globally
in 100+ countries


Enterprise Training Solutions Customized for Your Company
One partner for instructor-led corporate training, delivered the way your teams work.
Request a Training Quote- Customized Training Delivery
- Scale Your Training: Small to Large Teams
- In-person Onsite, Live Virtual or Hybrid Training Modes
- Plan from 2000+ Industry-ready Training Programs
- Hands-On Labs on Live Infrastructure, Led by Industry Experts
Data Visualization with Python and Modern BI Course Topics and Program Outline
Six instructor-led modules with guided labs, from visual foundations to a full capstone build.
Built by Edstellar with analytics practitioners
Built by practitioners who ship dashboards and analytics products in production, shaped around your stack and use cases.
We review your team's current dashboards and plotting habits to set the right starting point.
Instructors teach visual thinking, Python plotting, and BI modeling with live demos and examples.
Guided hands-on labs in Python and BI tools build real dashboards on data like yours.
Teams ship a capstone: Python analysis, published BI dashboard, and an executive insight story.
From first plot to published dashboard in 24 hours.
Delivered as
Sessions are instructor-led with live Q and A, and each module closes with a hands-on lab before the next topic.

Guided lab on auditing a flawed dashboard and redrawing it with correct encodings.
learna)Reading data structures
b)Scales and encodings
c)Avoiding misleading visuals
d)Chart selection framework
e)Prep workflows
Hands-on lab building a multi-panel exploratory figure pack from a real dataset.
learna)Figure and axes model
b)Statistical plots
c)Color and annotation
d)Faceting and layouts
e)Export for reports
Guided lab shipping an interactive sales-performance dashboard with filters and drill-downs.
practicea)Plotly express and graph objects
b)Interactive controls
c)Dashboard app structure
d)Callbacks and state
e)Deployment patterns
Hands-on lab publishing a governed, auto-refreshing KPI dashboard from a shared semantic model.
practicea)Data connections and refresh
b)Semantic models
c)DAX and measures
d)Dashboard design patterns
e)Sharing and governance
Applied lab converting raw findings into a 10-slide executive insight story with timed walkthroughs.
applya)Narrative structures
b)Insight hierarchy
c)Annotation and focus
d)Board-ready layouts
e)Handling questions
Capstone lab delivering a Python analysis, published BI dashboard, and executive story to instructor review.
applya)Scope and questions
b)Exploratory plotting
c)Dashboard build
d)Insight narrative
e)Review and polish
Customize this program tailored to your team?
Tell us your training needs: what your team already works with, the level they’re at, and the topics you want them to focus on. We’ll adjust the modules, duration and hands-on labs, and send you a customized outline for your group.
Key Skills and Outcomes Your Team Will Gain
Practical visualization skills your team uses from the first week back on the job.
Design Effective Charts and Dashboards
Choose the right visual encoding for the question and lay out dashboards that answer it in one glance.
Explore Data with Python Plots
Use Python plotting libraries to explore distributions, trends, and relationships quickly and reproducibly.
Build Interactive Plotly Dashboards
Create interactive figures and multi-page dashboard apps with filters, drill-downs, and shared state.
Model Data for Modern BI
Shape tables and measures in a semantic model so every report reads from the same trusted numbers.
Publish Governed BI Content
Deploy auto-refreshing dashboards with sharing rules and review workflows your team can rely on.
Craft Insight Narratives
Sequence visuals into a story with a clear point, annotation, and a recommended decision.
Audit and Fix Visual Misuse
Detect misleading scales, cluttered layouts, and bad defaults, then rebuild visuals the right way.
Teams that Benefit from this Data Visualization with Python and Modern BI Group Training
Built for analysts, BI developers, and business users who create or consume dashboards. Content adapts to role and experience so each cohort practices the workflows it owns.
Turn raw data into dashboards people trust
Analysts sharpen Python plotting, modeling, and dashboard design so stakeholders get answers, not spreadsheets.
Workflow friction
- Inconsistent dashboard quality
- Slow manual chart builds
- Unclear metric ownership
How the program helps
- Ship dashboards that match how people read
- Cut rework on metric definitions
- Standardize chart conventions
Practice use cases
- KPI dashboards
- Metric definitions
- Report automation
Build governed, refreshable BI content
BI teams practice semantic modeling, DAX-style measures, and publishing workflows that keep numbers consistent.
Workflow friction
- Sprawling ungoverned reports
- Fragile manual refreshes
- Conflicting KPI versions
How the program helps
- Model data once, reuse everywhere
- Automate refresh and sharing
- Design for mobile and desktop
Practice use cases
- Semantic models
- Auto refresh
- Content governance
Read and present data with confidence
Business stakeholders learn to request the right visuals and present insights that drive decisions.
Workflow friction
- Overloaded with raw data
- Static decks, no answers
- Fear of misreading charts
How the program helps
- Ask sharper data questions
- Present insights clearly
- Spot misleading visuals
Practice use cases
- Executive reviews
- Insight storytelling
- Decision briefs
Ship product analytics that guide roadmaps
Product groups wire event data into dashboards that track adoption and feature health.
Workflow friction
- Fragmented event data
- Vanity dashboards
- Slow insight loops
How the program helps
- Track adoption with one dashboard
- Compare cohorts visually
- Align teams on metrics
Practice use cases
- Funnel tracking
- Cohort analysis
- Feature health
We tailor datasets, BI examples, and lab depth to each department's workflows and tools.
Prerequisites: This program benefits analysts, BI developers, and business users who work with data. Familiarity with spreadsheets helps, and basic Python is a plus for the plotting modules. No prior BI platform experience is required, and labs adapt to each cohort's tools and data.
Analyst to Analytics lead
Learners move from reading charts to building interactive dashboards and governed BI content.
One program that grows with analytics careers, from first plots to confident, governed dashboard practice.
Mixed cohort, or several teams at once?
We can tailor the training to different teams, roles, and experience levels within the same program.
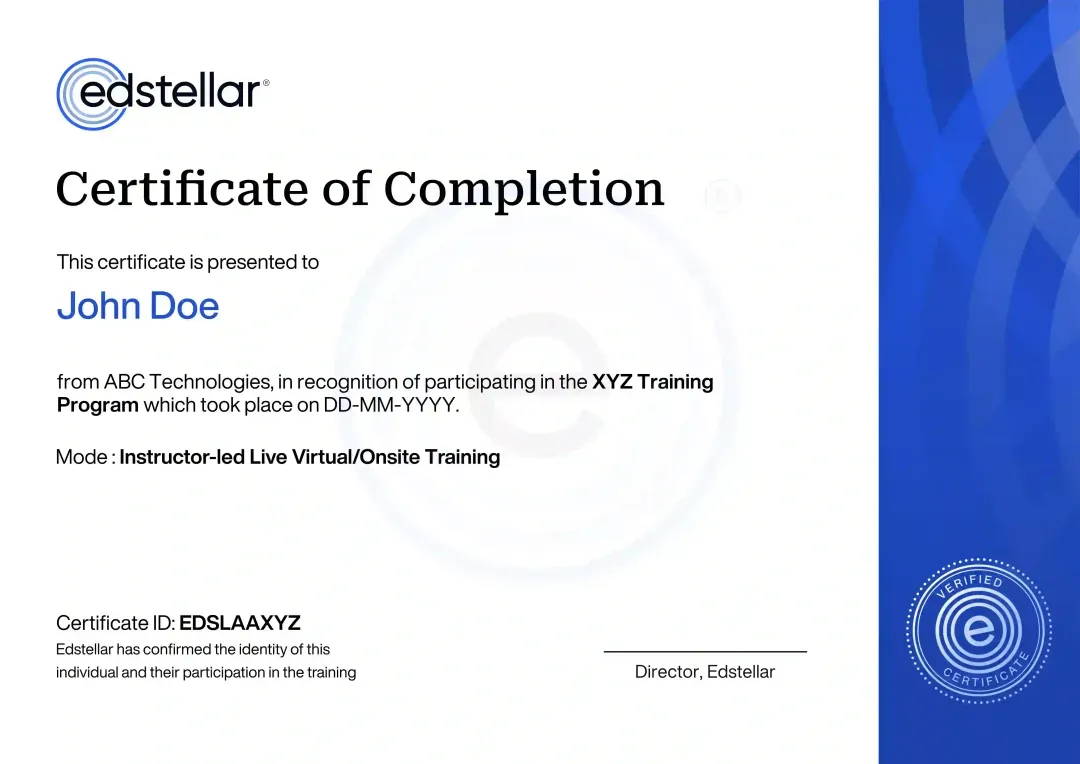
Certificate of Training Completion.
On successful completion, employees receive an Edstellar course completion certificate, recognizing their commitment to ongoing learning and professional development. It validates the skills they have built and motivates them to keep growing and contribute to organizational success.
Earned, not attended. Awarded on completion of all hands-on labs and the capstone project.
Training Delivery Modes: Virtual, Onsite and Hybrid
Choose how your team learns: live virtual, at your office, or a hybrid mix across cohorts.
Hybrid Training
Some learners join in person while others connect live online, with shared labs and dashboards for all.
- One agenda across locations
- Shared lab environments
- Instructor support for remote learners
- Flexible scheduling per cohort

Onsite Training
The full program runs at your office with lab environments prepared in advance for your team.
- Hands-on labs in your workspace
- Tools configured beforehand
- Team-specific datasets
- Direct instructor feedback

Live Virtual Training
Live instructor-led sessions online with breakout labs, shared notebooks, and real-time support.
- Live demos and Q and A
- Shared Python notebooks
- Breakout lab practice
- Digital materials access

Need a training format that works for your team?
Full days, half days across weeks, or split by module. Tell us the delivery window and we schedule the cohort around it.
Frequently Asked Questions
Share your team size, location, and preferred dates, and we send a tailored quote within one business day.
Yes, a short call aligns the agenda, tools, and datasets to your team's goals before scheduling.
Yes, it runs as live instructor-led virtual sessions with hands-on labs in shared notebooks and BI workspaces.
Yes, onsite delivery is available for teams, with lab environments set up in advance by our team.
The instructor-led program runs 24 hours across 6 modules, scheduled as full days or split sessions.
Question not answered here?
Put it in the request. A training specialist answers it directly, within one business day.
Where this Training Fits in Your Team's learning path.
Python visualisation and modern BI come third, after core Python and Python analytics. Your team needs clean, analysed data before charts mean anything. Once they can visualise it in code and BI tools, the final step teaches them to present it as a story people act on.
Why Choose Edstellar as Your Data Visualization with Python and Modern BI Training Provider
A provider focused on hands-on analytics skill your teams apply immediately.

EXPERT TRAINERS
YEARS DELIVERING
ORGANIZATIONS TRAINED
CERTIFIED
Tailored
Built around your data stack and metrics, so every lab mirrors the dashboards your team owns and maintains.
Proven Methodology
A learn, practice, and apply sequence that moves learners from first plot to published dashboard fast.
Practice-Based Learning
Guided hands-on labs in Python and BI tools build the muscle behind every concept taught in class.
Expert Trainers
Instructors who build analytics products in production and review each team's capstone personally.
Global Scale
One consistent curriculum delivered virtually or onsite across regions, time zones, and cohorts.
Measurable Outcomes
Module checkpoints and a capstone showcase show exactly what each learner can build on their own.
Connect Python Visual Analysis With Governed BI and Executive Storytelling
Edstellar develops visualization capability from exploratory figures to interactive dashboards and stakeholder narratives. Participants compare chart choices, build Python views, and publish a governed BI package. The final showcase reviews consistency between analysis, metrics, and the executive story, emphasizing accurate encodings and usable controls alongside polished presentation.
- Step 01
Consult
We assess spreadsheet and Python familiarity to identify gaps in chart selection, exploratory plotting, interactive dashboards, semantic measures, and presenting evidence to executives.
- Step 02
Plan
We establish visual thinking before Matplotlib and Seaborn, then Plotly interaction, governed BI delivery, and narrative development within the complete analytics showcase.
- Step 03
Align
We align visualization instruction with analysts, BI developers, and business users, adjusting Python support and platform exercises to the cohort's tools and experience.
- Step 04
Customize
We tailor sample performance data, flawed dashboards, and executive questions to relevant decisions while retaining consistent metrics and explicit publishing and refresh requirements.
- Step 05
Execute
Participants create figure packs, build interactive dashboards, and rehearse insight stories, receiving feedback on encoding accuracy, measure consistency, access controls, and narrative focus.
- Step 06
Evaluate
We assess the showcase for faithful visual analysis, coherent interactive and BI outputs, governed delivery, and an executive story supported by the displayed evidence.
Also from Edstellar
Talent assessments
Psychometric, behavioral, leadership and 360-degree assessment.
→Training needs analysis
Needs analysis, gap identification, and a training roadmap.
→L&D consulting
Learning strategy, content, technology and ROI measurement.
→OD consulting
Org design, succession planning and cultural change.
→Managed training services
Training outsourcing, vendor management, logistics and administration.
→Coaching solutions
Executive and manager coaching that keeps skills in use.
Start an RFP shaped to your needs.
Answer three quick questions about team size, scope, and how often you need the program run, then send the request from the last step. Everything you choose travels with it, so you only fill this in once.
How many team members need training?
Data Visualization with Python & Modern BI Training Training Packages & Pricing
Where L&D holds an annual budget, license packages price the whole year at once instead of raising a purchase order per workshop. Hours and licenses are pooled across teams, programs and locations, so unused capacity is not stranded in one department.
Starter
120
trainee licenses64 hours of group training
Tailored for SMBs
Growth
320
trainee licenses160 hours of group training
Ideal for growing SMBs
Enterprise
800
trainee licenses400 hours of group training
Designed for large corporations
Custom
Unlimited
trainee licensesDuration set by the rollout
Multi-region and multi-year
Training Packages & Pricing
Choose the training format that works for your team. Pricing is customized based on your requirements, cohort size, and delivery needs.
Request Data Visualization with Python and Modern BI Training for Your Team
Tell us about your team and goals, and we will tailor the agenda, datasets, and delivery mode.