

Data Analytics and Visualization Corporate Training
Turn raw business data into clear dashboards, reliable models, and decisions your leaders trust.
Turn raw business data into clear, decision-ready analytics. Employees learn to model and clean data, design interactive dashboards, and tell the story behind the numbers through guided labs led by practitioners. Each session is tuned to your data sources, tools, and workflows.
Instructor-led group trainingVirtual / on-site / hybrid10+ languagesDelivered in English, Spanish, Mandarin, German, Arabic, Portuguese, Hindi, French, Japanese, Italian, and more100+ countriesWe have delivered in United States, United Kingdom, India, Canada, Germany, France, Netherlands, UAE, Saudi Arabia, Singapore, Australia, Japan, Brazil, South Africa and 90+ more countries
How we build a data-driven analytics team
EDSTELLAR DATA ANALYTICS CAPABILITY MODEL
Diagnose analytics gaps
Skill checks map your team's data fluency, modeling basics, and visualization habits.
Standardize data practices
One shared playbook for clean data models, consistent metrics, and dashboard standards.
Practice in guided labs
Labs cover data preparation, modeling, dashboard design, and insight storytelling.
Measure the lift
Lab reviews benchmark each employee's dashboard quality and analytical accuracy.
Scale across teams
One analytics standard rolls out across functions, regions, and business units.
 Expert trainers
Need more than one program?Get a group quote
Trusted as a Leading Corporate Training Provider by
















Program Overview: What is Data Analytics and Visualization?

Data Analytics & Visualization is a 24-hour instructor-led program for teams that need to move from spreadsheets and static reports to reliable, decision-ready analytics. Participants learn to connect and prepare business data, build clean data models, design interactive dashboards, and present insights that leaders can act on. It is built for business analysts, reporting teams, and anyone whose stakeholders ask for answers, not exports.
Training runs as live sessions built around guided analytics labs. Teams prepare real datasets, build data models, discover insights and shape them into stories, and design interactive dashboards with publishing and governance baked in. Instructors with analytics experience coach each lab, correcting modeling choices and visualization discipline. The program closes with a capstone: an executive analytics package built from the team's own business data.
Static reports answer yesterday's questions and take a week to rebuild for today's. This program teaches the modern analytics workflow: prepared data, modeled once, visualized interactively, and governed so numbers stay trustworthy. Teams leave producing analytics that decision-makers open, use, and trust, instead of spreadsheets they export and forget.
The capstone is an executive analytics package: participants take a real business question from their own organization, prepare and model the data, build an interactive dashboard, and present the insight story to reviewers. It is scored on analytical rigor, design quality, and governance. Teams return with a working analytics asset their leaders can use immediately, plus the workflow to build the next one themselves.
Six modules and 24 hours: analytics tool setup, data modeling and preparation, insight discovery, dashboard design, governance and publishing. Every module pairs concepts with a guided lab, so each technique is practiced. It closes with a capstone executive analytics package the team plans, builds, and presents.
Delivery is hybrid across virtual and onsite sessions, scheduled around your calendar. Cohorts train as one group or split into batches, with session materials and lab guides included for every participant.
What's Included in this Workshop for Your Enterprise Teams
- 1
BI tool setup and data connections
Connect to your spreadsheets, databases, and files in guided setup.
- 2
Data modeling labs
Build clean, reliable models with joins and calculated fields.
- 3
Dashboard design practice
Design interactive dashboards leaders actually use.
- 4
Insight storytelling sessions
Turn analysis into clear narratives for decisions.
- 5
Publishing and governance
Share dashboards with controls and scheduled refreshes.
- Instructor-led delivery across virtual, onsite, and hybrid
- Guided labs in every module with instructor coaching
- Capstone analytics package, reviewed with your team
- Flexible scheduling around your calendar
- Lab guides and reusable dashboard templates included
- Group size and batches set along with you
Build your team's skills. Anywhere in the world.
Real-world use cases
from day one
Instructor-led training
for your teams
Delivered globally
in 100+ countries

Enterprise Training Solutions Customized for Your Company
One partner for instructor-led corporate training, delivered the way your teams work.
Request a Training Quote- Customized Training Delivery
- Scale Your Training: Small to Large Teams
- In-person Onsite, Live Virtual or Hybrid Training Modes
- Plan from 2000+ Industry-ready Training Programs
- Data Analysis Exercises, Led by Industry Experts
Data Analytics and Visualization Course Topics and Program Outline
A tailored 24-hour, six-module workshop: one learning journey from analytics setup to a capstone executive package. Sessions pair concepts with labs on real business data. Materials include lab guides and reusable dashboard templates for every participant.
Built by Edstellar with analytics practitioners
Built by practitioners who design dashboards and data models in production, shaped around your stack and use cases.
Skill checks baseline your team's data fluency, modeling basics, and dashboard habits before training begins.
Live instruction covers analytics setup, data modeling, and preparation across 7 focused hours.
Guided labs build insight discovery, dashboard design, and storytelling skill across 12 supervised hours.
Your team ships a capstone executive analytics package in 5 hours, reviewed for quality and clarity.
From analytics setup to a capstone executive package, every technique is practiced in guided labs.
Delivered as
Delivered as a hybrid program of live instruction and guided labs, scheduled around your team's calendar in flexible batches.

Connect to sample business datasets, configure the workspace, and validate data connections in a guided walkthrough.
learnConnecting to spreadsheets, files, and databases
Data types, field roles, and data quality basics
Workspace setup and naming conventions
Navigating the analytics interface
Build a clean data model from messy sales and finance files, adding calculated measures and validation checks.
learnCleaning and shaping raw datasets
Joining tables and defining relationships
Calculated fields, measures, and aggregations
Building a reusable star-style data model
Validating model accuracy against source data
Analyze a quarterly business dataset, define the KPI set, and draft the insight narrative for a leadership update.
practiceExploratory analysis for patterns and drivers
Defining KPIs aligned to business goals
Segmenting and comparing performance
Structuring an insight narrative for leaders
Design an interactive sales performance dashboard with filters and drill-downs, then refine it in a peer review.
practiceChoosing charts for the message
Layout, hierarchy, and visual clarity
Filters, drill-downs, and interactivity
Designing for executives versus operators
Reviewing and refining dashboard drafts
Publish a dashboard package with access controls, a refresh schedule, and a one-page documentation sheet.
applyPublishing dashboards and managing access
Scheduled refreshes and data alerts
Versioning and documentation standards
Monitoring usage and gathering feedback
Deliver a complete executive analytics package: modeled data, dashboard suite, and a 10-minute insight presentation.
applyPlanning the analytics package scope
Modeling and preparing the capstone dataset
Building the dashboard suite
Rehearsing the executive narrative
Capstone review and feedback
Customize This Program Tailored to Your Team?
Tell us your training needs: what your team already works with, the level they’re at, and the topics you want them to focus on. We’ll adjust the modules, duration and hands-on labs, and send you a customized outline for your group.
Key Skills and Outcomes Your Team Will Gain
Seven job-ready outcomes your team will demonstrate by the end of the program. Each competency is practiced in guided labs and reviewed in the capstone build.
Connect and prepare data sources
Connect to spreadsheets, databases, and files, and prepare clean datasets ready for analysis.
Build reliable data models
Define table relationships, joins, and calculated fields that keep dashboards trustworthy.
Define KPIs that matter
Translate business goals into measurable KPIs and track them consistently across reports.
Design clear interactive dashboards
Choose the right visuals, layout, and filters so dashboards answer questions at a glance.
Tell the story behind the data
Structure analysis into concise narratives that help leaders decide with confidence.
Publish and govern analytics content
Share dashboards with access controls, refresh schedules, and documentation standards.
Deliver an executive analytics package
Combine modeling, visualization, and storytelling into a boardroom-ready analytics deliverable.
Teams that Benefit from this Data Analytics and Visualization Group Training
This group training is built for business teams that own data, reports, and dashboards and want sharper, more trusted analytics. Content adapts to each cohort's roles, tools, and experience, so every batch practices the workflows it owns, from data prep to presentation.
Build dashboards the business actually uses.
BI analysts learn to model clean data and design interactive dashboards that answer real business questions in labs.
Workflow friction
- Messy source data and broken joins
- Dashboards nobody opens or trusts
- Inconsistent metrics across reports
How the program helps
- Reliable data models and measures
- Interactive, decision-ready dashboards
- Reusable templates and standards
Practice use cases
- Data modeling labs
- Dashboard design drills
- KPI standardization
Turn finance data into trusted insight.
Finance teams practice building models and dashboards that explain variance, margins, and forecasts clearly to leaders.
Workflow friction
- Manual spreadsheet-heavy reporting
- Slow month-end insight cycles
- Numbers leaders question
How the program helps
- Accurate models for planning cycles
- Variance and margin dashboards
- Clear narratives for leadership
Practice use cases
- Variance analysis labs
- Forecast dashboards
- Board pack storytelling
See what is working, and act on it.
Sales and marketing teams learn to track pipeline, campaign, and customer metrics in dashboards that guide weekly decisions.
Workflow friction
- Reporting scattered across tools
- Unclear campaign attribution
- Slow answers to ad-hoc questions
How the program helps
- Pipeline and campaign visibility
- Segmentation and cohort analysis
- Faster weekly reporting rhythms
Practice use cases
- Funnel dashboard labs
- Attribution analysis drills
- Weekly KPI reviews
Cohorts train as a cross-functional workforce, with each small group aligned on shared data standards and dashboard quality.
Prerequisites: This program benefits analysts, finance professionals, and business teams who work with data and reports. Basic spreadsheet comfort helps but is not required, and no prior BI tool experience is needed. Content adapts to each cohort's data sources, tools, and experience level.
Data Analyst to Analytics Storyteller
Tracks how analysts progress from basic data preparation to advanced storytelling across the program's learn, practice, and apply phases.
A program that grows with analytics careers, from first dashboard to confident data storytelling.
Different Teams, Locations, Time Zones, or Languages? We've Got You Covered.
Whether your teams are spread across countries, time zones, languages, or experience levels, we deliver tailored training programs that ensure a consistent learning experience across your global workforce.
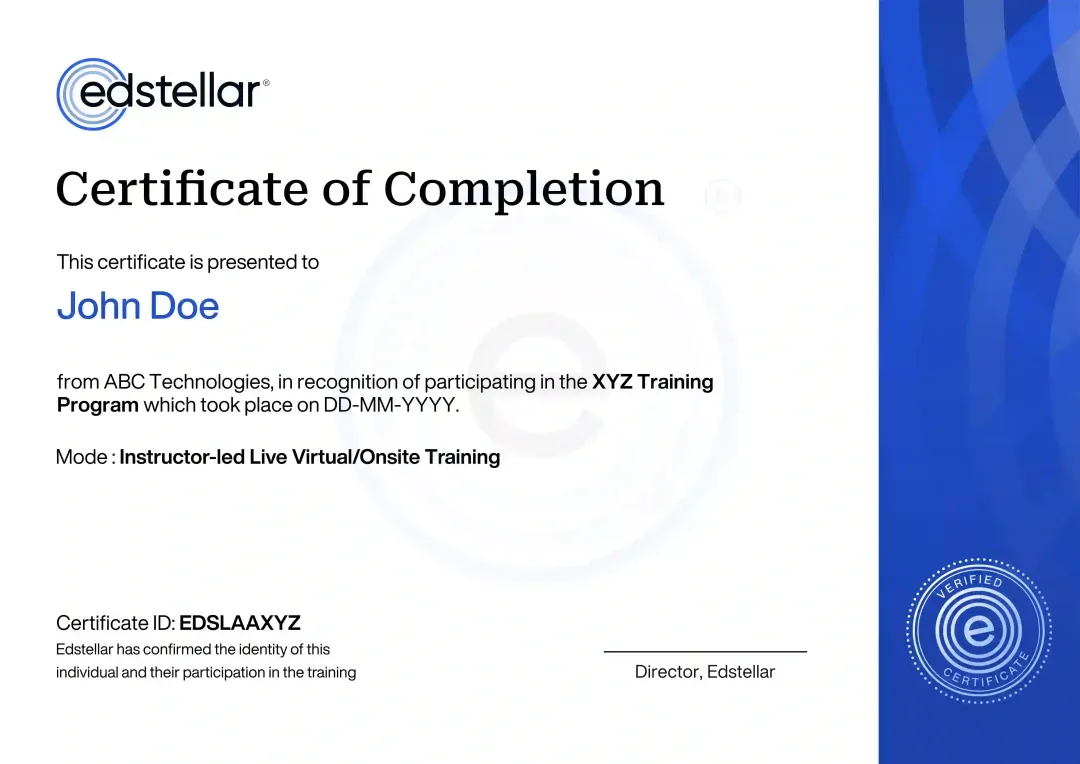
Certificate of Training Completion.
On successful completion, employees receive an Edstellar course completion certificate, recognizing their commitment to ongoing learning and professional development. It validates the skills they have built and motivates them to keep growing and contribute to organizational success.
Earned, not attended. Awarded on completion of all hands-on labs and the capstone project.
Training Delivery Modes: Onsite, Virtual and Hybrid
Live instructor-led delivery with guided labs in every module, scheduled around your team's calendar in flexible batches.
Data Analytics & Visualization Onsite Training
Instructor-led training at your offices, with labs set up on your network and tooling. The instructor works with the team in person, reviews dashboards together, and tunes exercises to your data and workflows.
- Instructor-led training at your offices
- Labs set up on your network and tooling
- In-person reviews of dashboard drafts
- Exercises tuned to your data and workflows

Data Analytics & Visualization Live Virtual Training
Live virtual sessions with screen-shared instruction and guided labs in your own environment. The instructor coaches through chat and breakout reviews, keeping every participant building.
- Live virtual instruction with screen sharing
- Guided labs in your own environment
- Breakout reviews with the instructor
- Same curriculum and coaching as onsite

Data Analytics & Visualization Hybrid Training
Instructor-led sessions mix onsite and virtual delivery with guided labs throughout. Teams build dashboards on their own data while the instructor coaches and reviews work. Hybrid keeps scheduling flexible without losing live interaction.
- Live instruction across onsite and virtual sessions
- Guided labs with instructor coaching and reviews
- Real business data in every practice exercise
- Flexible scheduling without losing live interaction

Need a Customized Training Format That Works for Your Team?
Our training delivery is customized to your team's schedule, full days, half days, sessions spread across weeks, or modular formats. Share your preferred timeline, and we'll plan the training around it.
Frequently Asked Questions
Edstellar focuses Data Analytics & Visualization on the work of business analysts and reporting teams. The organizational aim is to produce reliable interactive analytics with shared definitions and clear business interpretation. Instructor-led practice connects the subject to shared procedures and review standards, with pre- and post-training assessments and a post-training report included in the package price.
The published course is approximately 24 instructor-led hours. It connects Analytics Foundations and Tool Setup with applied implementation work and closes with an executive analytics package. Guided labs and instructor review let colleagues examine both the output and the reasoning behind it. Compare that learning sequence, the proposed trainer and the practice environment with your team’s actual skill gaps.
Data Analytics & Visualization training is one of Edstellar's 2,000+ instructor-led programs, delivered to enterprise teams in 100+ countries by a network of 5,000+ vetted trainers and coaches. Drawing on data analysts, the curriculum covers data analysis, visualization, dashboards and storytelling. Trainers are screened for subject expertise, industry experience and facilitation quality, and exercises can be built around your tools and use cases. Delivery is onsite, virtual or hybrid, with pre- and post-training assessments.
Look for a provider that understands your operating context, teaches practical skills and agrees how progress will be assessed. For Data Analytics & Visualization, check coverage of Analytics Foundations and Tool Setup, trainer experience and exercise relevance. Edstellar offers a tailored proposal so you can evaluate those elements alongside delivery logistics and commercial terms.
Trainer selection is matched to the agreed subject depth, participant roles and industry context. You can request the proposed trainer's profile and discuss relevant delivery experience before confirming. A scoping conversation helps establish whether the trainer can address your team's real work, rather than only explain the subject.
Question Not Answered Here?
Put it in the request. A training specialist answers it directly, within one business day.
Where this Training Fits in Your Team's learning path.
Data analytics and visualization is the second step, after analytics basics. Your team learns to analyze data and choose the right visuals before committing to one tool. Tableau then gives them a full platform for that work, and storytelling helps them present results well.

ANALYTICS BASICS
Business Analytics Fundamentals Training
Learn core analytics ideas, metrics and comparisons that every chart and dashboard should answer.

ANALYSE AND VISUALISE
Data Analytics & Visualization Training
Analyse business data and choose clear charts and layouts that show what the data actually says.
BUILD IN TABLEAU
Data Visualization with Tableau Training
Apply visualisation skills in Tableau, building interactive dashboards for business users.
TELL THE STORY
Data Storytelling & Infographic Design Training
Turn analysis and dashboards into data stories that explain the findings and what to do about them.
More related courses
Power BI & Microsoft Fabric Analytics Training
Data Visualization with Python & Modern BI Training
SQL for Business & Data Analytics Training
Why Choose Edstellar as Your Data Analytics and Visualization Corporate Training Provider
When comparing providers, Edstellar is the training partner teams choose for analytics expertise and 5+ years of corporate training experience. Our methodology blends concise instruction with guided labs, and we share each trainer profile before booking. The result is dashboards and insight your leaders trust.

EXPERT TRAINERS
YEARS DELIVERING
ORGANIZATIONS TRAINED
CERTIFIED
Tailored
Every cohort's labs, datasets, and examples are tuned to your data sources, BI tools, and business questions.
Proven Methodology
Concise instruction followed by guided labs and reviews, a repeatable method that turns data into trusted insight.
Practice-Based Learning
Six modules of guided labs and a capstone package keep your team analyzing, not just watching.
Expert Trainers
Practitioners who build dashboards and models in production lead every session and review your work.
Global Scale
One consistent analytics program delivered across your offices worldwide, in 10+ languages.
Measurable Outcomes
Lab checkpoints and a capstone review prove analytics gains you can report to leadership.
Turn Business Data Into Governed Dashboards and Clear Executive Insights
Edstellar connects data preparation and modeling with meaningful measures, visual design, and analytical storytelling. Participants build an interactive reporting package and examine its publishing controls before presenting findings. Review focuses on trusted calculations, clear interpretation, and the connection between data evidence and the decisions the audience needs to make.
- Step 01
Consult
We assess spreadsheet familiarity and reporting responsibilities to identify gaps in data preparation, model design, KPI definition, dashboard usability, and insight communication.
- Step 02
Plan
We establish connections and workspace foundations before modeling and measures, then insight narratives, dashboard design, and governed delivery within the executive package.
- Step 03
Align
We align analytics facilitation with analyst, finance, and business roles, providing BI foundations and practice tools suited to the cohort's data sources.
- Step 04
Customize
We tailor sample sales and finance files, KPI questions, and executive briefs to relevant decisions while maintaining explicit validation checks and access requirements.
- Step 05
Execute
Participants clean models, design interactive dashboards, and present insights, receiving feedback on calculation consistency, visual hierarchy, narrative evidence, and publishing controls.
- Step 06
Evaluate
We assess the analytics package for validated measures, usable dashboards, clear documentation, and a presentation that distinguishes findings from unsupported interpretations.
Also from Edstellar
Talent assessments
Psychometric, behavioral, leadership and 360-degree assessment.
→Training needs analysis
Needs analysis, gap identification, and a training roadmap.
→L&D consulting
Learning strategy, content, technology and ROI measurement.
→OD consulting
Org design, succession planning and cultural change.
→Managed training services
Training outsourcing, vendor management, logistics and administration.
→Coaching solutions
Executive and manager coaching that keeps skills in use.
Start an RFP shaped to your needs.
Answer three quick questions about team size, scope, and how often you need the program run, then send the request from the last step. Everything you choose travels with it, so you only fill this in once.
How many team members need training?
Data Analytics & Visualization Training Packages & Pricing
Where L&D holds an annual budget, license packages price the whole year at once instead of raising a purchase order per workshop. Hours and licenses are pooled across teams, programs and locations, so unused capacity is not stranded in one department.
Starter
120
trainee licenses64 hours of group training
Tailored for SMBs
Growth
320
trainee licenses160 hours of group training
Ideal for growing SMBs
Enterprise
800
trainee licenses400 hours of group training
Designed for large corporations
Custom
Unlimited
trainee licensesDuration set by the rollout
Multi-region and multi-year
Training Packages & Pricing
Choose the training format that works for your team. Pricing is customized based on your requirements, cohort size, and delivery needs.
Request a Quote for Data Analytics and Visualization Training for Your Team
Share your team size, data sources, BI tools, and timelines to receive a tailored training plan and quote. Book a discovery call to discuss your goals; we confirm availability and respond with a proposal.