Kano Model Explained: Prioritize Features That Sell & Delight Customers

.svg "edstellar")

Customer-centric product development hinges on understanding which features truly delight users and which merely meet basic expectations. Yet, many product teams end up with too many features to consider and subsequently have no idea where to start, with wrong choices potentially setting teams “back months” in time and cost.
In other words, guessing at features can waste resources and frustrate customers. The Kano Model addresses this challenge by categorizing features based on their impact on satisfaction. Developed in the 1980s by Professor Noriaki Kano, the Kano Model is a framework for product development and customer satisfaction that helps teams prioritize feature investments for maximum impact.
In this blog, you’ll see why data-driven feature prioritization (instead of intuition) is crucial, and how using Kano can boost customer satisfaction and ROI in product initiatives.
“When a Kano analysis is conducted, and its outcomes are applied, it will result in a profitable and competitive differentiator, where customers become excited about and loyal to your business."


The Kano Model is a theory of customer satisfaction that acknowledges that not all features are equal. Rather than simply listing customer requirements, it asks how each feature affects satisfaction or dissatisfaction. Kano’s research revealed that features fall into distinct categories of importance.
In its simplest form, the model identifies three levels of need , Expected, Normal, and Exciting, which Kano described as the levels of customer expectation. These later evolved into five categories: Basic (Must-be), Performance (One-dimensional), Delighter (Attractive), Indifferent, and Reverse.
In practice, the Kano Model is implemented through customer surveys. For each potential feature, customers are asked two questions: one about how they would feel if the feature is present, and one about how they would think if it is absent.
Each question has five possible responses (e.g., “I like it,” “I expect it,” “I’m neutral,” “I can tolerate it,” “I dislike it”). By cross-tabulating these responses for each feature, product teams classify features into the five Kano categories.
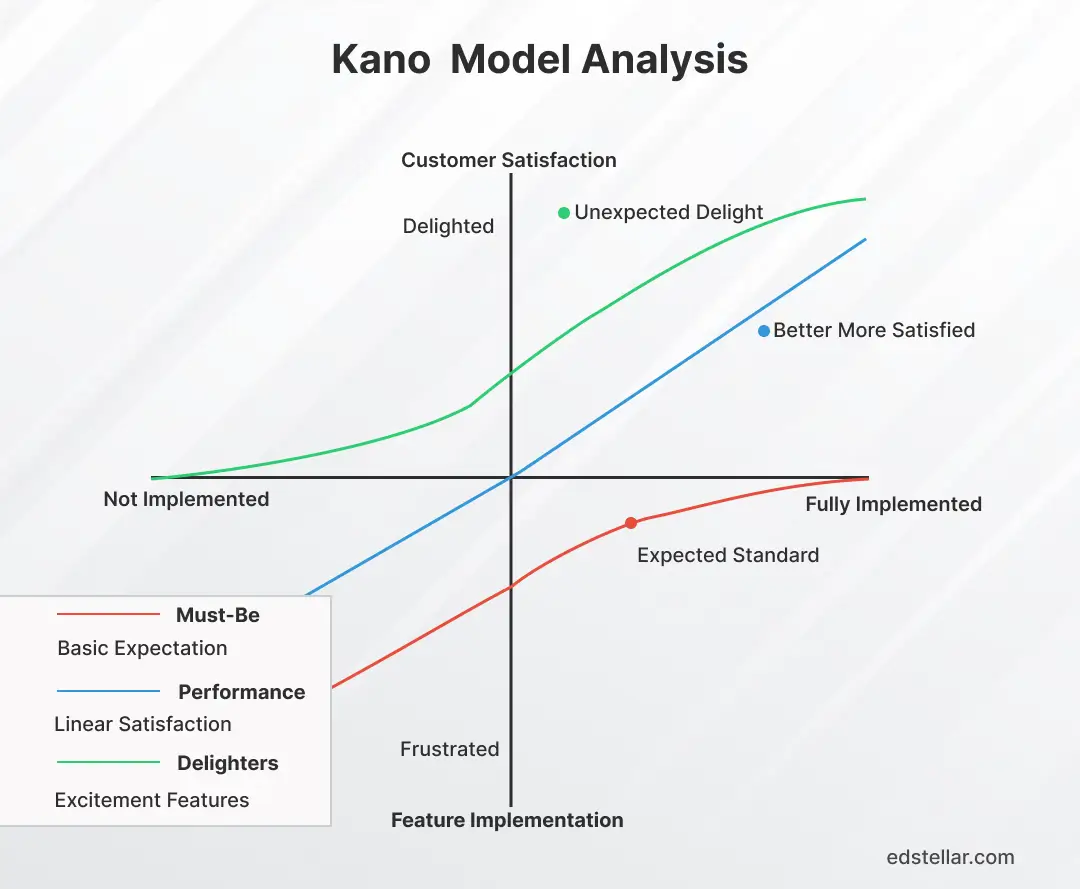
Kano’s insight was that these categories have different effects: some features (Basic) are expected and cause dissatisfaction if missing; some (Performance) proportionally raise satisfaction; others (Delighters) delight when present but are unnoticed when absent.
Kano divides features into five categories based on their impact on satisfaction. In brief:
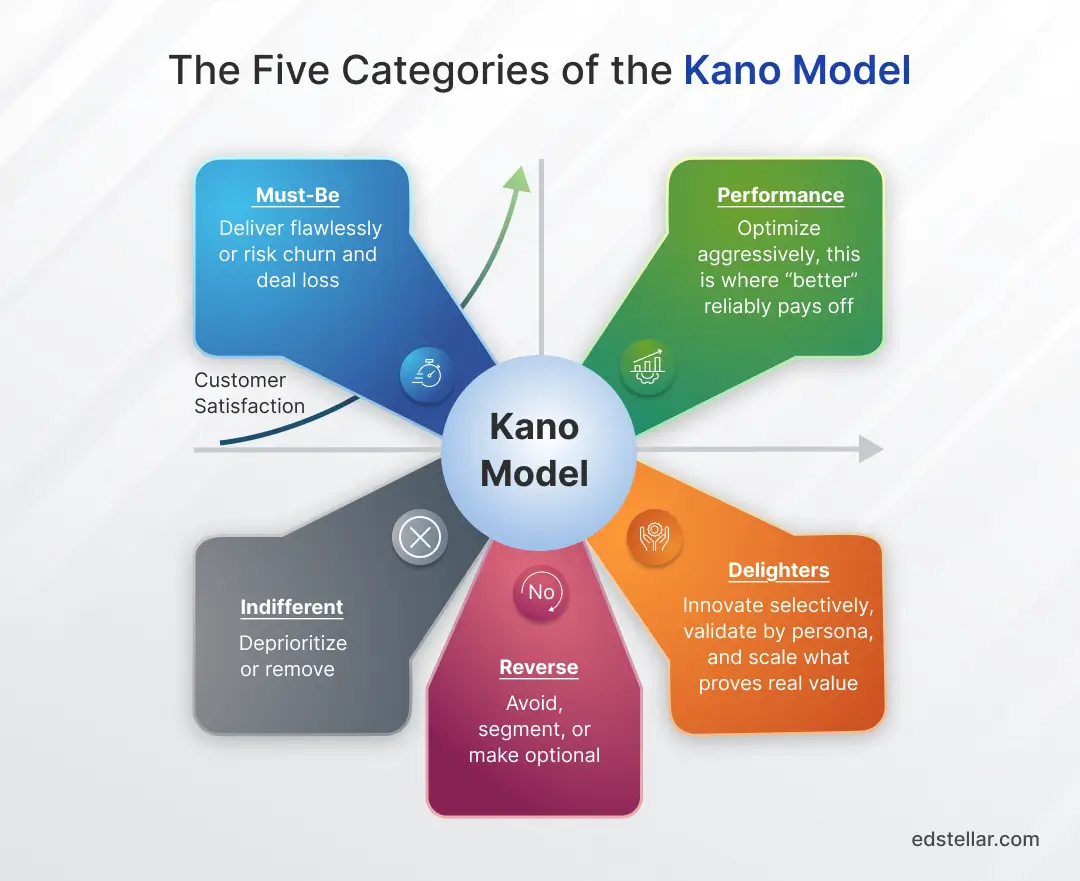
These are the fundamental requirements customers expect by default. If a must-be feature is missing or fails, customers become dissatisfied. If it’s present and functional, customers are simply neutral because they assume it should work. Kano described these as the price of entry into a market.
Example:
Single Sign-On (SSO), role-based access control (RBAC), audit logs, core security, and compliance controls. These are rarely praised when they work, but their absence can trigger immediate rejection in enterprise buying decisions.
In short, these are the “must-haves.” Forgetting them is a deal-breaker, while doing them well only meets baseline expectations.
These create satisfaction when they’re strong and dissatisfaction when they’re weak. More is better, less is worse. Customer satisfaction scales with performance.
Example:
Uptime reliability, API stability, latency, reporting speed, search accuracy, and workflow efficiency. Customers explicitly ask for these improvements, and competitors often fight on these dimensions.
These are typically where incremental investment produces predictable gains in customer satisfaction and retention.
These surprise and delight customers when present, but their absence doesn’t cause dissatisfaction. They’re unspoken “extras” that customers don’t necessarily expect until someone delivers them well.
Example:
Smart automation that removes manual steps, context-aware insights (“here’s the next best action”), proactive anomaly alerts, or AI summaries that actually save time without creating risk.
Delighters can create strong differentiation, but only if validated with the right personas. In enterprise products, a delighter for end users may be indifferent (or even risky) for compliance or IT stakeholders.
These have little or no effect on satisfaction. Whether present or absent, customers don’t care.
Examples:
Cosmetic admin UI tweaks, minor theme changes nobody requested, low-usage dashboard widgets, or “nice-to-have” settings that don’t improve outcomes.
Identifying indifferent features is valuable because they are prime candidates for cutting or saving costs, reducing product bloat, and protecting roadmap focus.
These cause dissatisfaction when present. A feature may be appealing to one segment but irritating or risky to another.
Examples:
Forced AI workflows, intrusive automation that removes user control, aggressive in-app upsells, or mandatory “assistant” features that disrupt established processes.
Reverse features should usually be avoided or made optional. The right strategy is often segmentation + opt-in, not a one-size-fits-all rollout.
Kano analysis is driven by customer feedback using a paired-question survey. For each proposed feature, customers (or target users) answer:
Each question uses five standard response options: I like it, I expect it, I am neutral, I can tolerate it, I dislike it.
The combination of answers determines the Kano category. For example, if a customer likes a feature when present and dislikes it when absent, it typically indicates a Performance (One-dimensional) feature. If they like it when present but feel neutral when absent, it suggests a Delighter (Attractive).
📋 Kano Questionnaire Format
After collecting responses, count how many answers fall into each category for every feature. The dominant category typically becomes the feature’s overall classification, which then guides prioritization and roadmap decisions.
Beyond categorization, Kano can quantify how strongly a feature influences satisfaction. A common approach is to compute Better (satisfaction) and Worse (dissatisfaction) coefficients using survey tallies.
First, define:
Then calculate:
How to interpret these scores:
By ranking features on both the Better and Worse, teams build a prioritization matrix.
A large digital publisher used the Kano model to guide the replatforming and mobile redesign of a high-traffic recipe site with millions of loyal users. Previous redesigns in related business units had failed due to feature removals based on assumptions, rather than evidence. To avoid repeating that mistake, the team applied Kano to classify features before development began.
They evaluated a set of existing and proposed features, including recipe saving, hands-free step-through videos, healthy ingredient alternatives, user comments, achievement badges, and pantry-based filtering, using standard Kano paired questions (functional vs. dysfunctional). Responses were collected via a manual survey distributed through internal and social channels, with demographic data captured for segmentation.
Raw responses were categorized into the five Kano types, Must-Have, Performance, Delighter, Indifferent, and Reverse, using a standard evaluation matrix and custom processing scripts. The analysis revealed clear patterns:
These findings directly determined what was included, enhanced, or excluded from the roadmap. Only Must-Have, Performance, and validated Delighter features were rebuilt or added. Indifferent and Reverse features were dropped, reducing scope and effort.
The outcome aligned precisely with Kano-driven priorities:
The Kano findings directly shaped the rebuild scope and roadmap. The team:
This approach reduced wasted rebuild effort and produced a more positive audience reaction than prior redesign attempts in other parts of the company.
By using Kano as a decision filter, not a suggestion, the team avoided subjective debates, accelerated delivery, and ensured the redesign met actual user expectations while introducing targeted innovations.
When applied with real user data, the Kano Model helps teams prioritize features based on customer impact rather than internal assumptions.
Used well, Kano doesn’t guarantee outcomes, but it creates a clearer, more defensible path to building the right features in the right order.
Implementing Kano analysis involves these key steps:
1. Define Your Objectives. Clarify what you want to achieve. Are you launching a new product, adding features, or improving an existing product? Setting goals (e.g., “increase retention by 10%”) guides the evaluation of which features to prioritize. Align with stakeholders on success metrics and scope (e.g., feature list, target user group) to ensure alignment and clarity of objectives.
2. Identify Features to Evaluate. List potential features or attributes relevant to customers. Include basic expectations (e.g., login, help center), performance candidates (e.g, faster load times), and innovative ideas (e.g., AI assistance). Brainstorm with cross-functional teams and sift through customer feedback to compile a comprehensive feature list.
3. Design Your Kano Questionnaire. For each feature, craft a functional question and a dysfunctional question (see table above). Use clear, non-technical language that customers will understand. Pre-test your survey with a small internal group. Draft questions, then refine the wording so that the meaning of each feature is obvious. Make sure to include consistent response options (like/dislike scale).
4. Collect Customer Responses. Distribute the Kano survey to real customers or target users. Methods can include email surveys, in-app questionnaires, or live interviews. Aim for a statistically meaningful sample (often at least 100–200 responses for mid-sized products). Launch the survey, set a deadline, and send reminders. Provide an incentive (discount, gift card) to boost participation. Ensure diverse respondents representing your target market.
5. Analyze and Categorize Results. Tabulate responses for each feature. Map each respondent’s paired answers onto the Kano evaluation matrix. The category with the most votes typically defines the feature’s classification. Create a spreadsheet tally. Mark each feature as Must-Be, Performance, Delighter, Indifferent, or Reverse. If needed, label any ambiguous cases as “Questionable” and consider further study.
6. Calculate Better-Worse Coefficients. Use the formulas from above to compute each feature’s Better (satisfaction) and Worse (dissatisfaction) scores. This quantifies each feature’s impact. For each feature, sum the counts of Delighter, Performance, Must-Be, and Indifferent votes. Compute the coefficients. This step converts categorical Kano results into numbers you can graph or rank.
7. Prioritize Features. Rank features based on category and coefficients. Generally, focus first on performance and delighter features with high Better scores (to drive satisfaction) and on must-be features with low Worse scores (to prevent dissatisfaction). Low-impact features (Indifferent or low Better/Worse) go lower on the backlog.
Sample of Feature Prioritization Matrix:
In this example, Real-Time Collaboration (Performance) and Advanced Reporting have the highest priority; they both greatly boost satisfaction (Better high) and prevent dissatisfaction if absent (Worse significant). Auto-Play Videos is flagged as Reverse: development would likely annoy users, so it is slated for removal.
8. Action Plan & Continuous Review. With priorities set, update your product roadmap–plan development sprints around the Kano findings. But remember: customer expectations evolve. Schedule periodic Kano reviews (see Advanced section below) to adjust priorities over time. Assign owners to each feature, set deadlines, and monitor key metrics (customer satisfaction scores, adoption rates). After releasing features, retest customer satisfaction to measure the impact.
By following these steps, teams transform Kano analysis from raw survey data into a clear, actionable product strategy. The visual feature prioritization matrix above provides a quick way to share decisions with stakeholders.
Implementing Kano requires care. Watch out for these pitfalls:
Solution: Repeat Kano surveys periodically (e.g., annually or when major product shifts occur) to capture changing expectations.
Solution: Establish clear decision criteria (e.g., build anything with a Better score >0.6 or a top Performance score). Treat Kano output as the starting point for roadmap planning, not an academic exercise.
Solution: Never assume “AI = delight.” Test AI features like any other, using role-specific Kano segments, and validate emotional response, not just novelty.
Beyond the basics, teams can deepen their use of the Kano Model through strategic adaptations:
Feature Evolution Over Time
Kano categories are not fixed. A feature that starts as a Delighter, like mobile check-in for airlines, can become a Performance feature and eventually a Must-Have as user expectations shift. Teams should plan to reassess features periodically. What surprises users today may be expected tomorrow, requiring proactive roadmap evolution.
Industry-Specific Applications
The Kano framework adapts well across sectors:
Continuous Kano Analysis
Rather than treating Kano as a one-time audit, teams can benefit from integrating it into regular planning cycles. For example, a product team might consider running lightweight Kano surveys:
In practice, Kano is most powerful when treated as a dynamic input to product strategy, not a static snapshot. By revisiting classifications over time and tailoring questions to context, teams can ensure their investments continue to match what users truly value.
Applying the Kano Model effectively means protecting Must-Be features, improving Performance attributes where “more is better,” and validating, not assuming Delighters (especially AI features that can vary by persona). It also requires cutting Indifferent and Reverse features to reduce waste and avoid product bloat. Because expectations evolve over time, Kano insights should be refreshed periodically to keep roadmaps aligned with real user needs.
To build this capability across product and CX teams, Edstellar offers instructor-led Kano Customer Satisfaction Model Training and Strategic Product Management & Customer Analytics, tailored for organizations that want to embed evidence-based prioritization into roadmaps and redesign decisions.
Contact our training consultants or explore our offerings by scheduling a demo to learn how targeted upskilling can embed Kano thinking into your product strategy, customer experience, and long-term competitive advantage.
#On-site #Virtual #GroupTraining #Customized
Explore 2000+ industry ready instructor-led training programs.

Create dynamic leaders and cohesive teams. Learn more now!

Do a quick Skill gap analysis with Edstellar’s Free Skill Matrix tool

Unlock premium resources, tools, and frameworks designed for HR and learning professionals. Our L&D Hub gives you everything needed to elevate your organization's training approach.
Access L&D Hub Resources.svg)


.svg "Click Here to Follow on Medium")