.svg "edstellar")


Content
Table of Content
Most CEOs are not short of numbers; they’re drowning in them. Every board cycle brings thick packs on revenue, EBITDA, profit, and pipeline. Those are essential, but they mostly answer “What happened?” and “Did we hit the plan?” They’re much weaker at answering the questions that actually keep a CEO up at night:
- How fragile is this performance?
- Where is execution quietly slipping?
- What risks are building up that the P&L won’t show for another 3–6 quarters?
McKinsey’s report has repeatedly shown that around 70% of them fail to achieve their stated goals. And the pattern is familiar: it’s rarely because senior teams had the wrong slide deck strategy; it’s because they never built the conditions for execution, ownership, behaviours, cross-functional collaboration, and capabilities to make that strategy real.
Jeff Bezos captured the CEO’s real job in his shareholder letter:
“We will continue to measure our programs and the effectiveness of our investments analytically, to jettison those that do not provide acceptable returns, and to step up our investment in those that work best."

Jeff Bezos

That is the point of CEO-level KPIs: not to decorate a dashboard, but to decide what to stop, what to double down on, and where execution risk is compounding out of sight.
This article introduces ten CEO-level KPIs that are deliberately different from the usual finance and sales metrics. They focus on questions like:
- Is our EBITDA actually high-quality and repeatable?
- How reliable is our free cash flow, quarter after quarter?
- Are our strategic bets, talent, and customer base concentrated in ways that quietly increase risk?
Taken together, these KPIs are designed to give CEOs earlier, sharper signals about execution, resilience, and the durability of enterprise value so they can reallocate attention, capital, and leadership before the headline numbers start to crack.
The 10 CEO KPIs That Matter Most
Traditional CEO dashboards focus on lagging metrics that surface problems only after performance is already damaged. The CEO KPIs below act as leading indicators, highlighting execution bottlenecks, capability gaps, customer behaviour shifts, and risk concentration before they show up in the P&L. Together, they give CEOs the visibility needed to steer strategy, allocate capital, and intervene early with confidence.
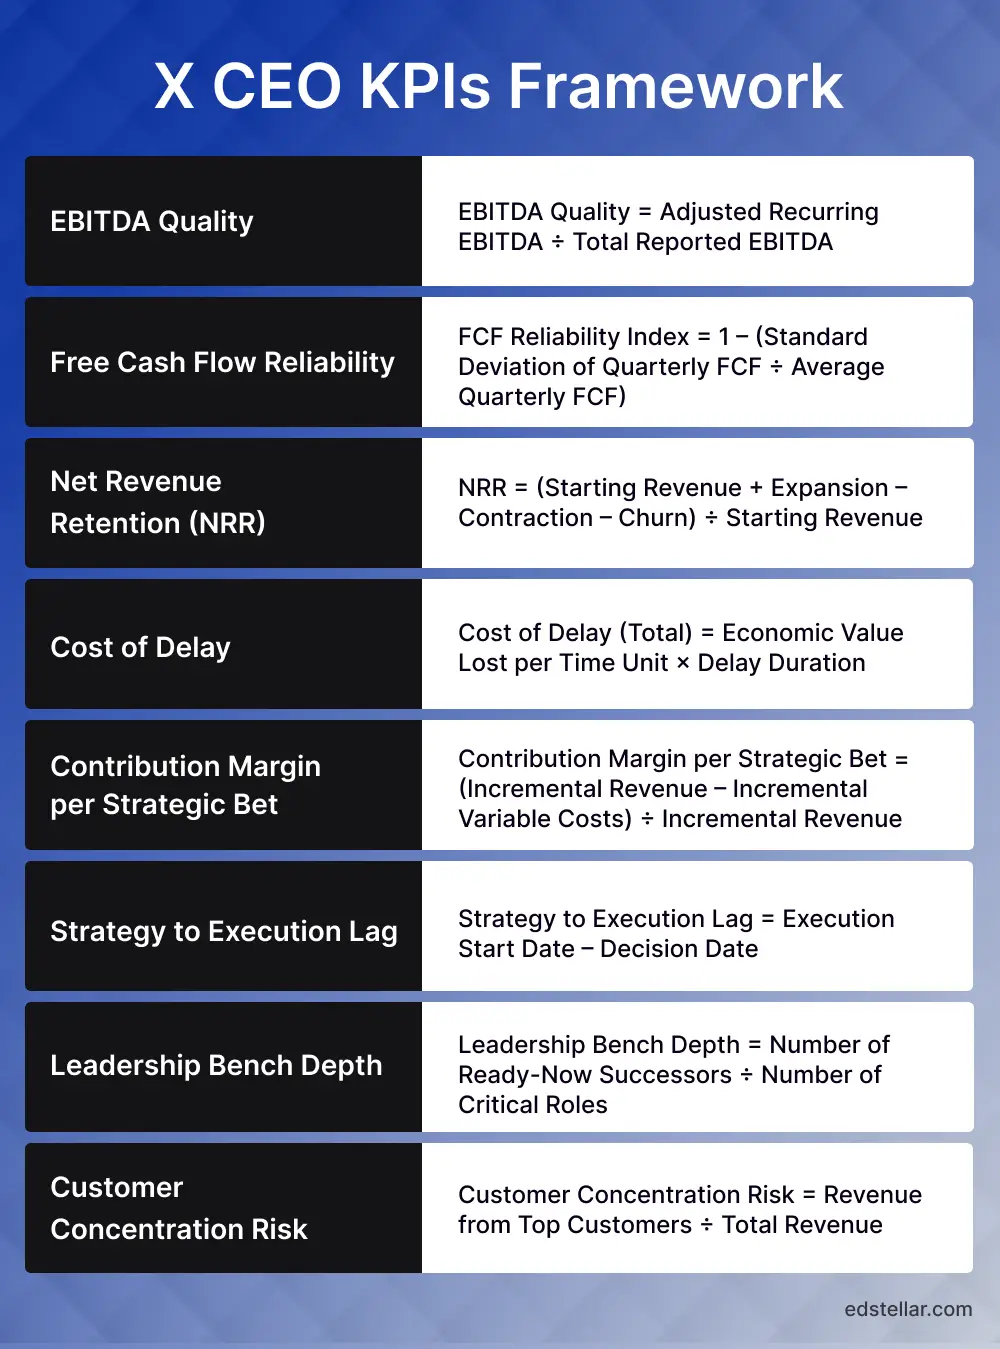
1. EBITDA Quality
EBITDA Quality measures how much of reported EBITDA is recurring, cash-backed, and derived from core operations. It strips out one-time gains, accounting reclassifications, and extraordinary items to show the true strength of the earnings engine.
Where:
- Total Reported EBITDA = EBITDA as reported in financial statements.
- Adjusted Recurring EBITDA = EBITDA minus one-offs (e.g., settlements, asset sales, unusual FX gains) and non-operational items, plus any necessary normalizations.
Headline EBITDA can look strong while the underlying engine is weak. Item-level adjustments reveal how dependable performance really is.
- High EBITDA Quality → strong, repeatable earnings and more predictable cash generation.
- Low EBITDA Quality → fragile earnings, higher risk that “growth” won’t repeat (pricing gimmicks, aggressive capitalisation, one-off gains).
CEO Action:
Implement a quarterly earnings-quality review that:
- Separates recurring vs non-recurring EBITDA line by line.
- Flags any KPI improvements that are driven mainly by one-off items or accounting changes.
- Tracks EBITDA Quality over time as a board-level risk indicator, not just a finance footnote.
2. Free Cash Flow Reliability
Free Cash Flow Reliability measures how stable and predictable free cash flow is over time. It shows whether cash generation comes from steady operations or is overly influenced by timing differences, working capital swings, and one-off items.
- Higher index (closer to 1) = more reliable cash flow.
- Lower index = unstable, harder-to-plan cash flow.
CEO-Level Use and Actions:
- Review FCF Reliability alongside EBITDA and revenue to avoid being misled by purely P&L-driven KPIs.
- Make cash flow predictability, not just total cash, a KPI for business unit and operational leaders.
- Tie leadership incentives partly to working capital performance and FCF stability, not only growth metrics.
3. Net Revenue Retention (NRR)
Net Revenue Retention (NRR) measures how much recurring revenue you retain and expand from existing customers only over a period, after accounting for churn and downgrades. It shows whether the current customer base is growing or shrinking in value without counting new logo wins.
Where (for the chosen period, e.g., month or year):
- Starting Revenue = Recurring revenue from existing customers at the beginning of the period.
- Expansion = Additional revenue from those same customers (upsells, cross-sells, seat increases, price uplift).
- Contraction = Revenue reductions from those customers (seat reductions, downgrades, discounts).
- Churn = Revenue lost from customers who fully cancel.
CEO-Level Use and Actions
- Track NRR by segment (customer size, industry, product line) to spot where value erosion or saturation is happening.
- Use NRR as a board-level indicator of product-market fit durability, customer success effectiveness, and competitive pressure.
- Align incentives across sales, CS, and product so they own NRR together, not just new bookings.
4. Cost of Delay
Cost of Delay (CoD) quantifies the economic value you forfeit by delaying a strategic decision, product release, or operational improvement. It makes the trade-off between speed and value explicit, so slow execution carries a visible price tag.
To make that calculable, define: Economic Value Lost per Time Unit (per week or per month, pick one and standardize):
Typically estimated as:
- Forecasted incremental profit/cash flow per period
- Or risk-adjusted NPV per period for the initiative
Delay Duration = Number of periods (weeks/months) the initiative is postponed beyond the originally required / value-optimal date.
You can then track either or both:
- Total Cost of Delay per Initiative (absolute currency)
- Portfolio Cost of Delay (sum across top initiatives in a quarter)
CEO-Level Use and Actions
- Require major initiatives to quantify the Cost of Delay alongside expected ROI and payback
- Use CoD as an input to prioritization: high-CoD items should move earlier in the roadmap and get faster paths through governance
- Hold teams accountable not only for delivering scope and ROI, but also for managing delay-driven value erosion
5. Contribution Margin per Strategic Bet
This KPI measures the economic value created by each strategic initiative (“bet”) by looking at how much contribution it generates after variable costs. It lets CEOs see which bets are genuinely accretive and which are just burning capacity.
Where:
- Incremental Revenue = Additional revenue directly attributable to the initiative in the period
- Incremental Variable Costs = Variable costs that scale with that revenue (e.g., COGS, delivery costs, success-based commissions)
Use Contribution Margin per Bet to understand the unit economics of each strategic initiative.
Use Contribution per Investment Dollar (if you adopt it) to rank bets by economic output per $ invested.
Low contribution margin or poor contribution per invested dollar signals: Mispriced offerings, bloated delivery models, or misaligned initiatives that are not pulling their economic weight.
CEO-Level Use and Actions:
- Review the contribution margin per strategic bet quarterly for all major initiatives
- Explicitly compare bets on the same basis (same cost definitions, same time windows)
- Redirect budget, capacity, and leadership attention away from chronically low-contribution initiatives into ones with stronger economics
6. Strategy to Execution Lag
Strategy to Execution Lag measures the time gap between when a strategic decision is formally approved and when execution actually starts. It exposes how quickly the organization can translate intent into action.
Where:
- Decision Date = Date on which the strategic decision/initiative is formally approved (e.g., board / ExCom sign-off)
- Execution Start Date = Date on which meaningful execution begins (e.g., project kickoff, first deployment, first customer-facing change).
Measure in days or weeks, and track:
- Per the major initiative, and
- As a median/average lag across all strategic initiatives.
CEO-Level Use and Actions:
- Set maximum acceptable lag thresholds for different initiative types (e.g., pricing, product, org changes).
- Require reporting of Strategy to Execution Lag on major initiatives and escalate when thresholds are breached.
- Use patterns in lag data to pinpoint and fix specific bottlenecks (governance, approvals, handoffs).
7. Leadership Bench Depth
Leadership Bench Depth measures how well critical roles are covered by ready-now successors, indicating how resilient the organization is to leadership transitions.
Where:
- Critical Roles = Roles that have disproportionate impact on strategy, revenue, risk, or culture
- Ready-Now Successors = Internal candidates assessed as able to step into the role within 0–6 months with minimal disruption
You can also track this by:
- Function (e.g., Sales, Operations, Tech)
- Level (e.g., C-suite, business unit heads)
CEO-Level Use and Actions:
- Review bench depth for all critical roles at least annually, ideally quarterly
- Tie leadership development, succession planning, and high-potential programs explicitly to improving Leadership Bench Depth
- Set minimum coverage thresholds (e.g., at least one ready-now successor per critical role) and flag any gaps for targeted action
8. Customer Concentration Risk
Customer Concentration Risk measures how much of your total revenue is exposed to a small set of top customers (e.g., top 1–5). It shows how vulnerable the company is to a single client’s decisions.
Where:
- Revenue from Top Customers = Combined annual revenue from the top N customers (commonly top 1, top 3, or top 5 by revenue)
- Total Revenue = Total annual revenue from all customers
Express this as a percentage (e.g., “Top 5 customers = 42% of total revenue”).
CEO-Level Use and Actions:
- Set concentration ceilings (e.g., no single customer >X% of revenue; top 5 <Y%)
- Track concentration quarterly by segment and geography
- Use this KPI to guide account diversification, pricing strategy, and risk management decisions
9. Talent Flight Risk
Talent Flight Risk estimates the likelihood that high-value employees (e.g., critical roles, top performers, successors) will leave within the next 12 months, based on performance criticality, engagement, tenure patterns, and external demand for their skills.
Where each component is scored on a 0–25 scale:
- Performance Criticality (0–25)
- Higher score = higher impact on business performance if this person leaves
- Engagement Risk (0–25)
- Based on survey results, manager feedback, and behavioural signals (reduced participation, etc.)
- Higher score = lower engagement / higher dissatisfaction
- Tenure Risk (0–25)
- Reflects where the employee is in typical “move/leave” patterns for the role/market (e.g., just past usual promotion window, long without progression, or at a known churn point)
- Market Demand (0–25)
- Higher score = stronger external demand and ease of switching (role scarcity, salary gap, active hiring in market)
You can then interpret:
- 0–30 = Low flight risk
- 31–60 = Moderate risk
- 61–100 = High risk
(Adjust thresholds if needed, but keep them explicit.)
CEO-Level Use and Actions
- Track Talent Flight Risk monthly or quarterly for critical roles and top performers
- Tie leadership expectations and HR priorities to reducing high-risk scores through development, progression, manager quality, and rewards
- Use this KPI alongside Leadership Bench Depth to understand both succession coverage and retention risk in one view
10. Cross-Functional Flow Efficiency
Cross-Functional Flow Efficiency measures the share of total lead time during which work is actively progressing, versus sitting in queues, handoffs, or waiting for approvals, inputs, or resources. It reveals how much of the timeline is true value-creating work vs organizational friction.
Where:
- Active Work Time = Time when someone is actually working on the task or item.
- Total Lead Time = Time from work start to completion, including all waiting, handoffs, and queues.
Express this as a percentage:
Flow Efficiency (%) = (Active Work Time ÷ Total Lead Time) × 100
You can use internal bands such as:
- Low Flow Efficiency: < 10%
- Medium Flow Efficiency: 10–25%
- High Flow Efficiency: > 35%
CEO-Level Use and Actions:
- Run flow efficiency diagnostics on key cross-functional processes (e.g., product launches, pricing changes, major customer projects)
- Simplify approval chains, reduce unnecessary handoffs, and clarify ownership where waiting time is high
- Track Flow Efficiency over time as a leading indicator of organizational agility and execution quality
Conclusion
Strategy usually doesn’t fail because the direction is wrong; it fails because leaders can’t see early enough where execution is slowing, where risk is concentrating, and where capability gaps are starting to bite. The ten CEO KPIs in this article shift attention from rear-view financials to the drivers that will shape results over the next few quarters the quality and reliability of earnings, the behaviour of your existing customers and strategic bets, the speed of strategy-to-execution, and the strength of your leadership pipeline and critical talent.
Used together on a single, tightly curated dashboard, these indicators give CEOs a clearer basis for decisions: what to stop, what to accelerate, and where to intervene personally. The goal isn’t to add more reporting noise, but to create one view that makes execution risk, resilience, and value creation visible enough to act on before the P&L starts to crack.
On the capability side of that picture, Edstellar can help you turn these KPIs into concrete action. A structured Skills Matrix gives visibility into the skills and role readiness behind metrics like Leadership Bench Depth and Talent Flight Risk, while Edstellar’s catalog of 2,000+ corporate training programs provides targeted ways to close the gaps you surface, rather than relying on generic learning spend.
Frequently Asked Questions
.svg "Click Here to Follow on Medium")
Explore High-impact instructor-led training for your teams.
#On-site #Virtual #GroupTraining #Customized
Edstellar Training Catalog
Explore 2000+ industry ready instructor-led training programs.

Coaching that Unlocks Potential
Create dynamic leaders and cohesive teams. Learn more now!
Explore 50+ Coaching Programs

Want to evaluate your team’s skill gaps?
Do a quick Skill gap analysis with Edstellar’s Free Skill Matrix tool
Get Started

Transform Your L&D Strategy Today
Unlock premium resources, tools, and frameworks designed for HR and learning professionals. Our L&D Hub gives you everything needed to elevate your organization's training approach.
Access L&D Hub Resources.svg)
Featured Post
More Blog Insights
Tell us about your corporate training requirements
FOLLOW US