

Quick Overview
- Employee training metrics are the quantitative measures that show whether training improves skills, performance, and business outcomes.
- This guide covers 15 KPIs across five groups, from engagement and learner experience to learning, business impact, and cost and ROI.
- Metrics tell you what happened, while KPIs tie those numbers to targets and business goals so you can prove value to finance.
- The core ROI formula is (Training Benefits - Training Costs) / Training Costs x 100, and the strongest programs report it on a regular cadence.
The assessment and improvement of staff training programs have become essential to the success of organizations. One critical component of this field is employee training metrics, which capture the systematic assessment and evaluation of training results, efficiency, and performance inside an organizational structure. These measures offer a thorough grasp of how training programs affect staff growth, operational effectiveness, and overall company performance.
Employee training metrics essentially act as a compass for businesses, pointing them in the direction of strategic planning and well-informed decision-making. Companies can maximize their training programs’ impact by quantifying important training elements, such as performance improvement, information retention, and skill acquisition. Companies can use these indicators to find areas for improvement, identify strengths, and coordinate training initiatives.
Ultimately, the wise use of employee training metrics enables companies to cultivate a culture of ongoing learning, flexibility, and creativity, guaranteeing a better workforce.
What are Employee Training Metrics?
Employee training metrics are quantitative measures used to evaluate the effectiveness and impact of training programs on the workforce. These metrics provide insights into various aspects of training, such as how engaging it is, whether employees are getting the information, and if they are applying what they have learned to their job roles. Additionally, these metrics assess the satisfaction levels of employees with the training provided and measure the time it takes them to become proficient in the skills taught.
These metrics enable organizations to refine their training strategies, ensuring they are cost-effective and aligned with the company's goals, ultimately leading to a more skilled, efficient, and satisfied workforce.
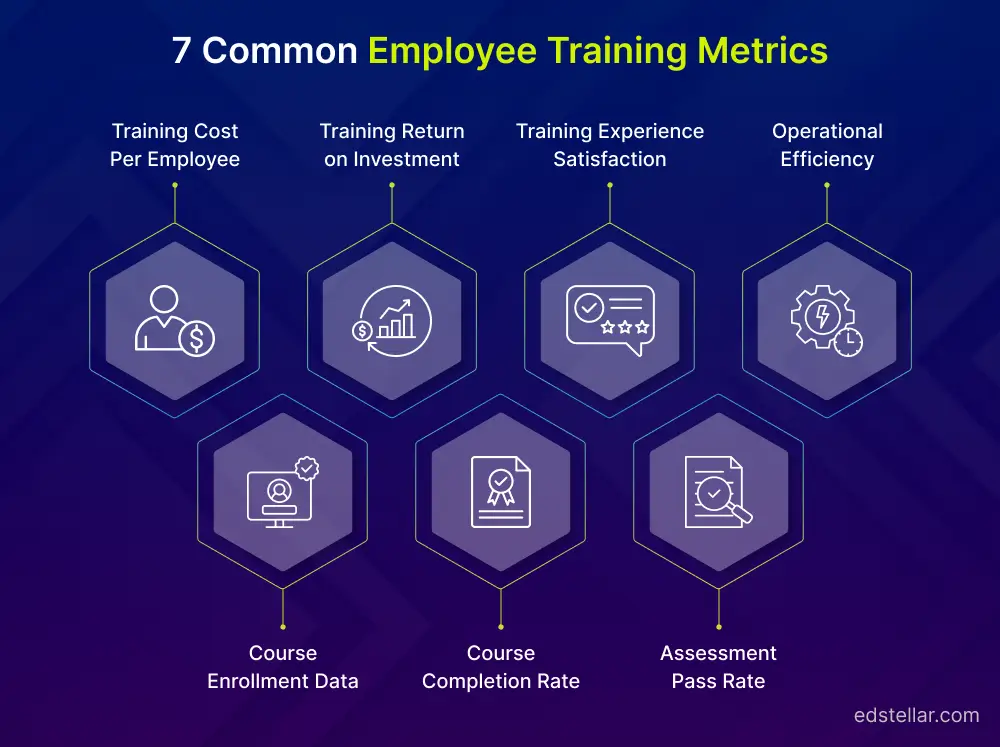
7 Common Employee Training Metrics
Here are some common employee training metrics:
1. Training Cost Per Employee
This refers to the total money spent on training divided by the number of employees who receive that training. While calculating this metric, several potential costs include the amount spent on content development, the instructor's fee, the technology used, and much more. To calculate the training cost per employee, you would add up all these expenses and divide them by the number of employees participating.
To calculate this employee effectiveness metric, use the following:
Training Cost per Employee = Your company’s total training costs / total number of employees receiving the training
2. Training Return on Investment
This employee training metric is used to evaluate the monetary benefit gained by investing in the training of your employees compared to the amount of money you invested in the training. This metric helps you assess the effectiveness and efficiency of your training programs concerning the value you invested in the program. To calculate this metric, you need to determine your training benefits, quantify the training costs, and estimate the training benefits in financial terms. Use the following formula:
|
Training ROI = (Training Benefits - Training Costs) / Training Costs Multiply the result by 100 to express it as a percentage. Consider: If your organization invested $200,000 in a training program and $300,000 was seen as increased productivity, then this would be the Result: Training ROI = (($200,000 - $100,000) / $100,000) * 100 = ($100,000 / $100,000) * 100 = 100% |
3. Training Experience Satisfaction
Training experience satisfaction is one of the most popular employee training metrics to measure. The result is generally found using a post-training survey, which is designed to estimate the satisfaction of employees with their training experience. You can use a score rating to answer questions like “How likely would you recommend this session to your friend?”
Net Promoter Score(1 to 10) is generally used with these questions. After collecting the results, you can determine whether your training was successful. Following is a general score and its meaning:
- NPS Score between 0 to 30 is moderate.
- An NPS Score of >30 is excellent.
- NPS Score <0 is a cause for concern.
4. Operational Efficiency
If your training effectively addresses your workforce's skill gaps, it should improve your company's operational efficiency.
Let's say currently you are missing about 20% of your deadlines. Now, if you introduce an employee training program to address this specific issue, then there should be a noticeable improvement in your work performance concerning meeting the work deadlines. This could include a good percentage of your work completed within the stipulated time. Operational metrics such as 'time to repair,' 'time to recover,' and 'time to failure' can be measured before and after training to note any efficiency improvement.
5. Course Enrollment Data
This employee training metric is used solely to measure the number of employees enrolled in the training course you provided. To assess the efficacy of various pictures and headers you choose to use in presenting your training plan to workers, you can conduct A-B tests using multiple messages.
In addition, it identifies whether the course is suitable for employees. Small actions (such as encouraging management to advertise courses to teams) can boost enrollment, and the change can be observed over time.
6. Course Completion Rate
You've launched a brand new program for employee training. One thousand employees enrolled in the course. However, only 50 students completed the entire course. It is possible to calculate the completion rate by determining the percentage of the course a student has completed by using the formula below:
Rate = (Number of users who completed the course/Total number of users who signed up)*100
This means that the rate at which courses are completed is 5%. Bit-sized and gamification are innovative ways to motivate employees to complete their courses.
7. Assessment Pass Rate
A test pass rate is the number of learners who completed or failed a course that they took. For instance, if 300 employees were to take tests after the course, and only 65 could pass, that's an overall score of 21.6 percent. The training effective metric can be calculated by using this formula:
This could mean that the test was challenging or was designed to remove the best employees. If your passing rate and assessment scores are surprisingly low, it is possible to identify the source of the issue. When they completed your course, did participants lose the knowledge they acquired at the start of the course? Do the questions demand excessive details, or were they not needed?
Occasionally, employees have to take an exam until they have passed it. Regulations mandate these assessment passing rates and scores to provide information on an organization's legal education (such as training for regulatory requirements to ensure compliance).
Why Should You Use Training Metrics for Training Evaluation?
Employee training metrics are essential to an organization’s development and success. The following are the top five advantages of using and keeping an eye on these metrics:
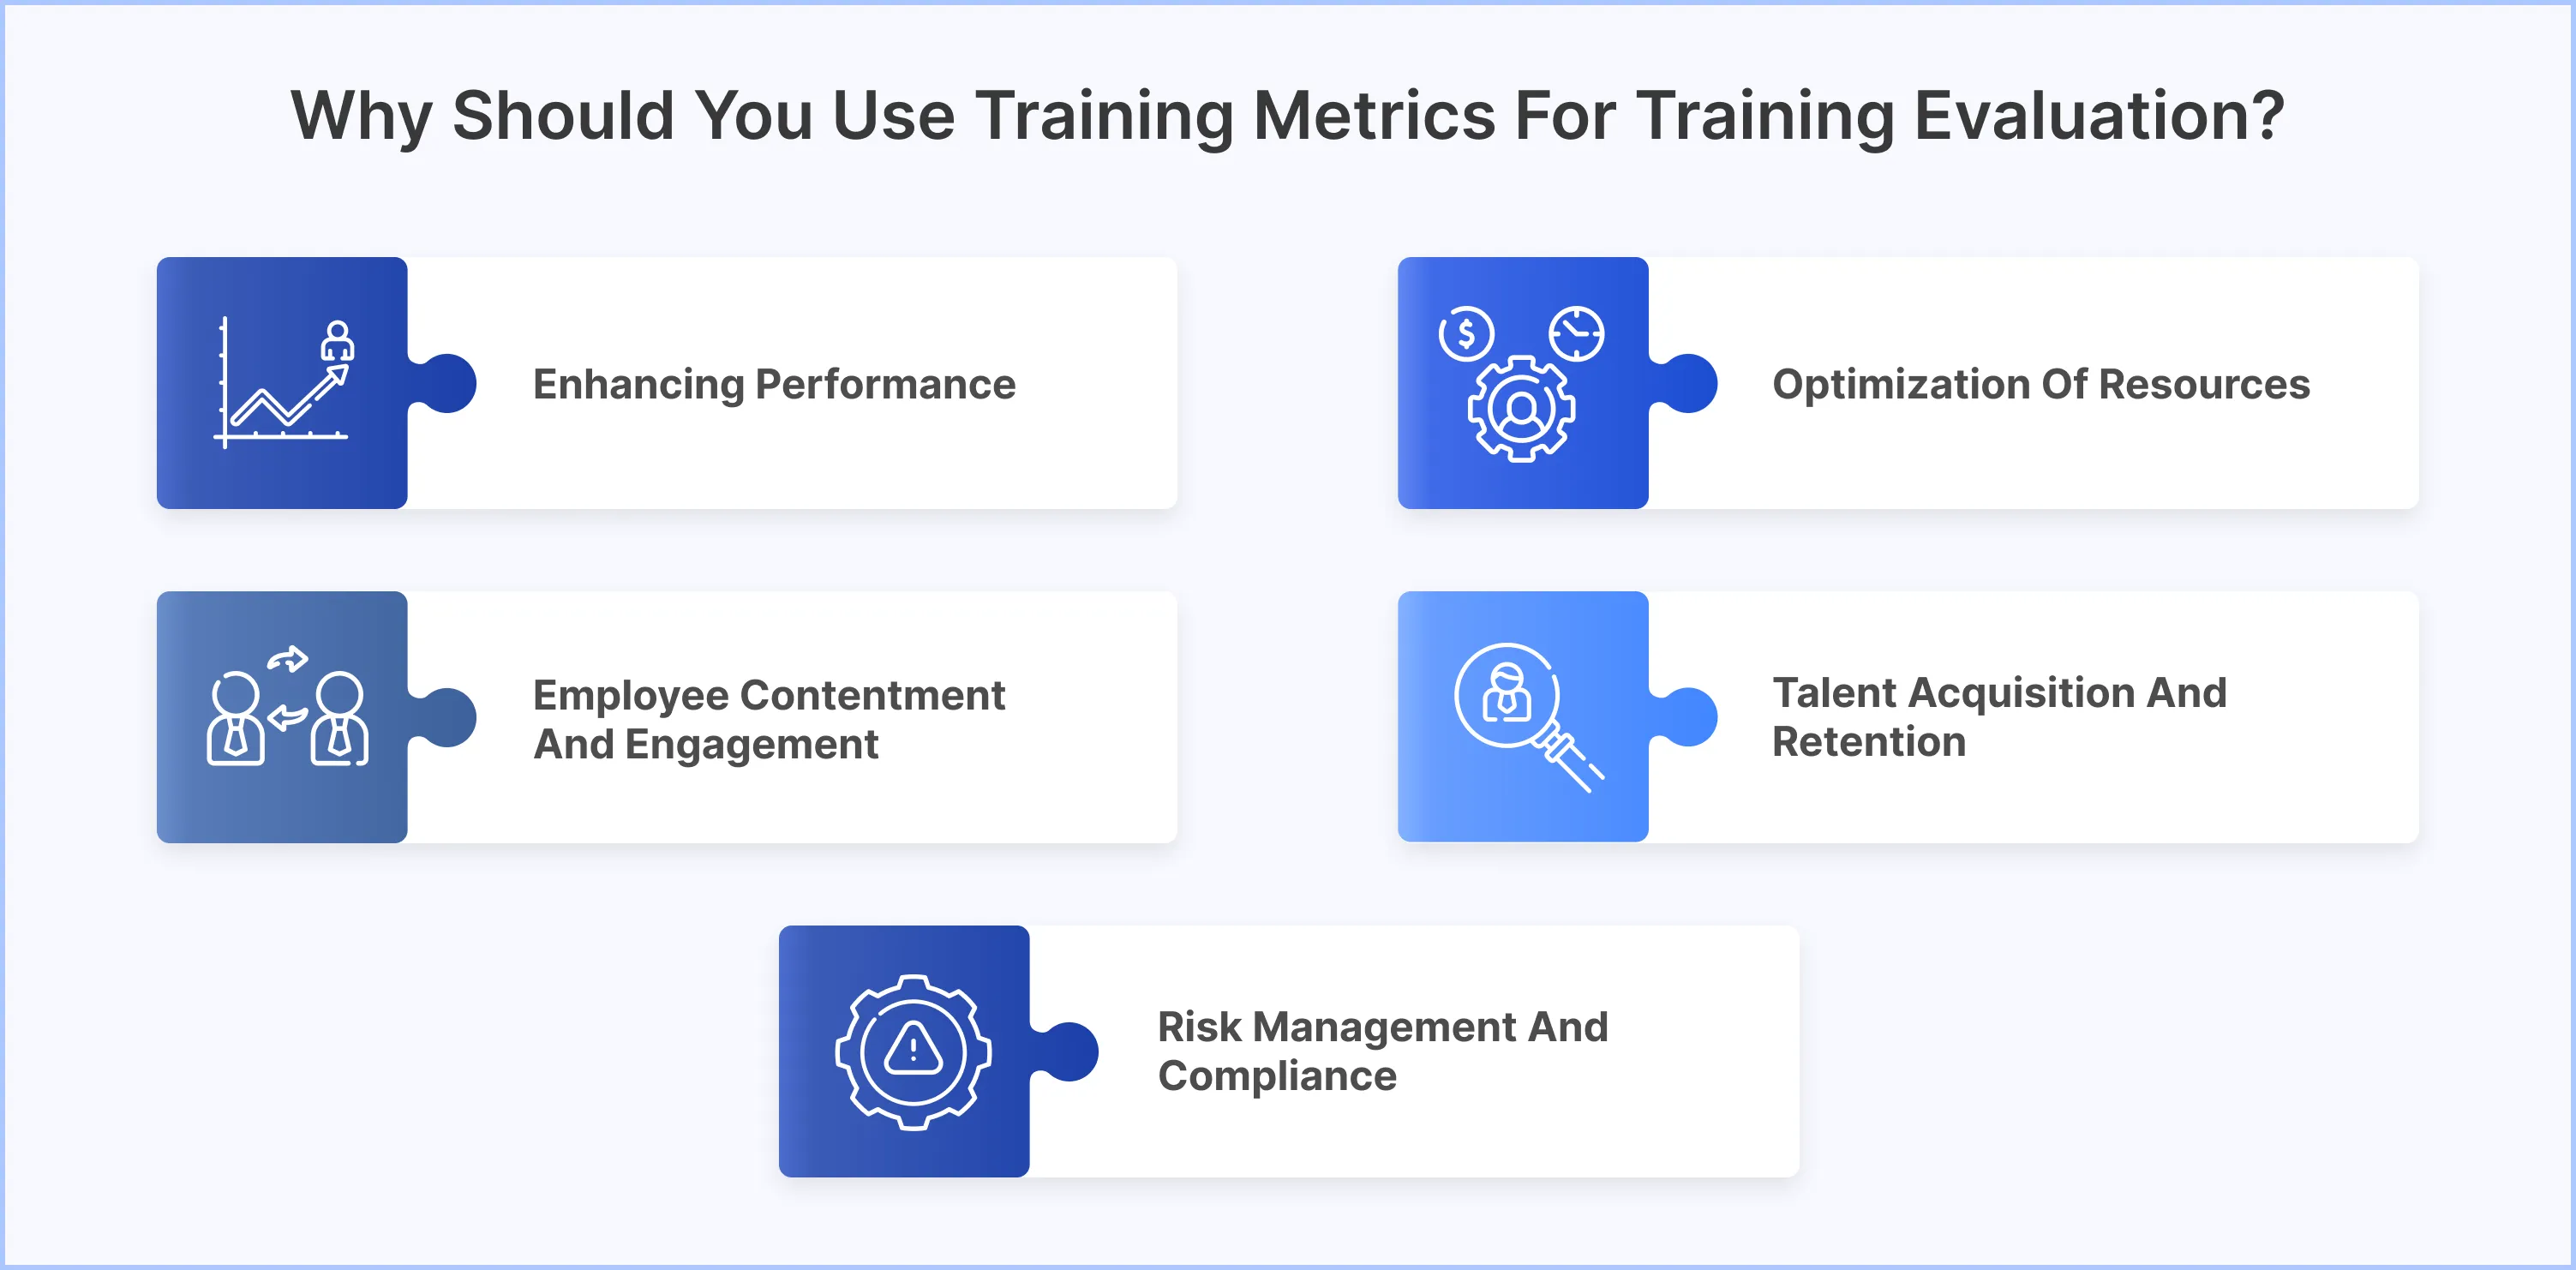
1. Enhancing Performance: Training metrics offer valuable perspectives on the efficacy of training initiatives. Organizations can pinpoint opportunities for improvement by comparing performance measures, such as employee performance before and following training. With this data, training materials and approaches can be improved to better suit the objectives of the business and enhance performance of the employees.
2. Optimization of Resources: Employee training metrics aid in the effective resource allocation of organizations. Businesses concentrate on training programs to ensure they get the best outcomes for the critical projects they are working on. This guarantees that training expenditures are maximized, improving return on investment (ROI).
3. Employee Contentment and Engagement: Employee engagement and program satisfaction can be measured using training measures. Employers can evaluate how well the training satisfies employees’ requirements by tracking attendance, engagement rates, and feedback metrics. Elevated engagement and satisfaction foster a favorable work environment and can improve employee morale.
4. Talent Acquisition and Retention: Talent development and retention are facilitated by effective training metrics. Workers who feel their employer supports their professional development are more inclined to stick around. Employee training metrics monitoring post-training career advancement can be used to pinpoint high-potential workers, aiding in succession planning and lowering attrition. This ultimately leads to a workforce that is more steady and skilled.
5. Risk Management and Compliance: Training metrics are essential for guaranteeing workplace compliance with regulatory requirements. Organizations can demonstrate compliance with industry and legal standards by tracking and recording staff training activities. This lowers the possibility of non-compliance while improving the organization’s standing and fostering stakeholder trust.
Conclusion
Employee training metrics emphasize the importance of measuring important factors like performance improvement, information retention, and skill acquisition to optimize training programs properly. Businesses can enhance their training by using training effectiveness metrics to find the in-depth examination of their employees’ skills and competencies.
Are you struggling to navigate your path toward measuring your employees’ skills? If that’s the case, collaborating with Edstellar can be highly beneficial for you. Their skill matrix tool enables you to understand the skill gaps among your employees and bridge them effectively through targeted training using AI-equipped technology.