

Data Visualization and D3.js Corporate Training
Learn to build stunning visualizations with D3.js, in live guided labs led by practitioners.
Build clear, interactive visualizations with D3.js that people can actually read. Employees develop D3.js, dashboard, and storytelling skills through guided labs led by practitioners. Each session is tuned to your stack, tools, and workflows.
Instructor-led group trainingVirtual / on-site / hybrid10+ languagesDelivered in English, Spanish, Mandarin, German, Arabic, Portuguese, Hindi, French, Japanese, Italian, and more100+ countriesWe have delivered in United States, United Kingdom, India, Canada, Germany, France, Netherlands, UAE, Saudi Arabia, Singapore, Australia, Japan, Brazil, South Africa and 90+ more countries
How we build a dataviz-capable team
EDSTELLAR DATA VISUALIZATION CAPABILITY MODEL
Assess dataviz skills
Skill checks map your team's Data Visualization and D3.js baseline and gaps.
Set shared standards
One shared playbook for Data Visualization and D3.js workflows, reviews, and quality bars.
Practice in guided labs
Labs cover D3.js, dashboards, and storytelling.
Measure the lift
Lab checkpoints benchmark each employee's Data Visualization and D3.js capability.
Scale across teams
One consistent standard rolls out across projects, sites, and teams.
 Expert trainers
Need more than one program?Get a group quote
Trusted as a Leading Corporate Training Provider by
















Program Overview: What is Data Visualization and D3.js?

Data Visualization and D3.js is a 19-hour program for data analysts, frontend developers, and BI teams building with data. Across 5 modules it covers visualization design, D3.js, custom charts, dashboards, and storytelling. It suits teams that need custom, interactive data visualization.
Training is hands-on: every concept is taught through guided labs: participants bind data with D3, build interactive and geographic charts, design dashboards, and craft visual stories. Labs use real datasets, with instructor review at every stage.
Teams struggle with weak visuals: misleading charts, cluttered dashboards, and findings nobody acts on. This program builds real dataviz skill: design principles, D3.js mastery, and storytelling. Your data gets understood.
A 5-hour capstone closes the program, where participants take a brief and deliver a portfolio-ready visualization project.
What's Included in this Workshop for Your Enterprise Teams
- 1
Tailored curriculum
Modules tuned to your tools and workflows
- 2
Instructor-led sessions
Live guidance from visualization engineers
- 3
Guided labs
Labs on realistic tasks
- 4
Skills assessments
Checkpoints track progress module by module
- 5
Post-training support
Workbooks, recordings, and follow-up guidance
- Hybrid, Live virtual, Onsite delivery options
- Flexible scheduling across your time zones
- Dedicated training coordinator for your cohort
- Digital workbooks and session recordings
- Customized modules for your Data Visualization and D3.js stack
- Post-training support and resources
Build your team's skills. Anywhere in the world.
Real-world use cases
from day one
Instructor-led training
for your teams
Delivered globally
in 100+ countries

Enterprise Training Solutions Customized for Your Company
One partner for instructor-led corporate training, delivered the way your teams work.
Request a Training Quote- Customized Training Delivery
- Scale Your Training: Small to Large Teams
- In-person Onsite, Live Virtual or Hybrid Training Modes
- Plan from 2000+ Industry-ready Training Programs
- Coding Exercises and Projects, Led by Industry Experts
Data Visualization and D3.js Course Topics and Program Outline
A 19-hour, 5-module Data Visualization and D3.js curriculum: foundations first, then labs, then a capstone that proves the skill on the job.
Built by Edstellar with data visualization engineers who build D3.js products
Built by data visualization engineers who build D3.js products, shaped around your stack and use cases.
Skill checks map your team's Data Visualization and D3.js baseline so the program targets real gaps.
Instructor-led concepts build Data Visualization and D3.js foundations your team can explain and use.
Labs across 2 hands-on modules build Data Visualization and D3.js muscle with instructor coaching.
A 5-hour capstone applies Data Visualization and D3.js end to end with instructor review.
A 19-hour path from Data Visualization and D3.js foundations to a reviewed capstone, tuned to your stack.
Delivered as
Sessions run hybrid | live virtual | onsite; scheduling flexes across your time zones and team calendars.

Critique and redesign weak visualizations.
learnVisual perception basics
Chart selection
Design for clarity
D3.js ecosystem tour
Build interactive charts with D3.
learnSelections and data binding
Scales and axes
SVG essentials
Transitions and animation
Build custom and geographic visualizations.
practiceLayouts and hierarchies
Geographic visualizations
Custom visualizations
Performance with big data
Build an interactive dashboard story.
practiceDashboard design
Narrative visualization
Interactivity patterns
Accessibility in dataviz
Deliver a portfolio-ready visualization project.
applyBrief to visualization
Design iteration
User testing basics
Portfolio presentation
Customize This Program Tailored to Your Team?
Tell us your training needs: what your team already works with, the level they’re at, and the topics you want them to focus on. We’ll adjust the modules, duration and hands-on labs, and send you a customized outline for your group.
Key Skills and Outcomes Your Team Will Gain
By the end of this Data Visualization and D3.js program, your team will be able to build stunning visualizations with D3.js.
Visualization design
Design clear, honest visualizations.
D3.js
Build interactive charts with D3.js.
Data binding
Bind data to visuals correctly.
Custom charts
Create custom visualizations.
Dashboards
Design effective dashboards.
Visual storytelling
Tell stories with data.
Dataviz delivery
Deliver portfolio-ready work.
Teams that Benefit from this Data Visualization and D3.js Group Training
Data analysts, frontend developers, BI teams, and product teams working with data learn together. Content adapts to role and experience, so each cohort practices the visualization workflows it owns.
Visualize insight
Analysts communicate through charts. This program turns their findings into visuals people understand.
Workflow friction
- Weak charts
- Misleading visuals
- Ignored findings
How the program helps
- Choose the right charts
- Design for clarity
- Get findings noticed
Practice use cases
- Chart selection
- Clarity
- Impact
Add D3 skill
Frontend teams build data products. D3.js depth lets them ship custom visualizations.
Workflow friction
- Chart library limits
- Generic dashboards
- No custom viz skill
How the program helps
- Build custom D3 visuals
- Go beyond libraries
- Ship data products
Practice use cases
- Custom D3
- Beyond libraries
- Data products
Better dashboards
BI teams live in dashboards. This training raises their design and interactivity bar.
Workflow friction
- Cluttered dashboards
- Low adoption
- Static reports
How the program helps
- Design cleaner dashboards
- Drive adoption
- Add interactivity
Practice use cases
- Clean design
- Adoption
- Interactivity
Data-driven products
Product teams embed analytics. Visualization skill helps them design data features users love.
Workflow friction
- Weak data features
- Confusing analytics
- Low engagement
How the program helps
- Design clear data UI
- Make analytics usable
- Engage with visuals
Practice use cases
- Data UI
- Usability
- Engagement
Cohorts are grouped by role and experience so every session targets the workflows your people own.
Prerequisites: This program suits professionals with basic JavaScript and data familiarity; HTML and CSS help. No prior D3 experience is needed. Content adapts to each cohort's stack.
Analysts to visualization builders
Cohorts start with design and D3 foundations, build advanced technique practice, and finish with dashboard and portfolio delivery.
One program grows with data careers, from charts to custom visualization.
Different Teams, Locations, Time Zones, or Languages? We've Got You Covered.
Whether your teams are spread across countries, time zones, languages, or experience levels, we deliver tailored training programs that ensure a consistent learning experience across your global workforce.
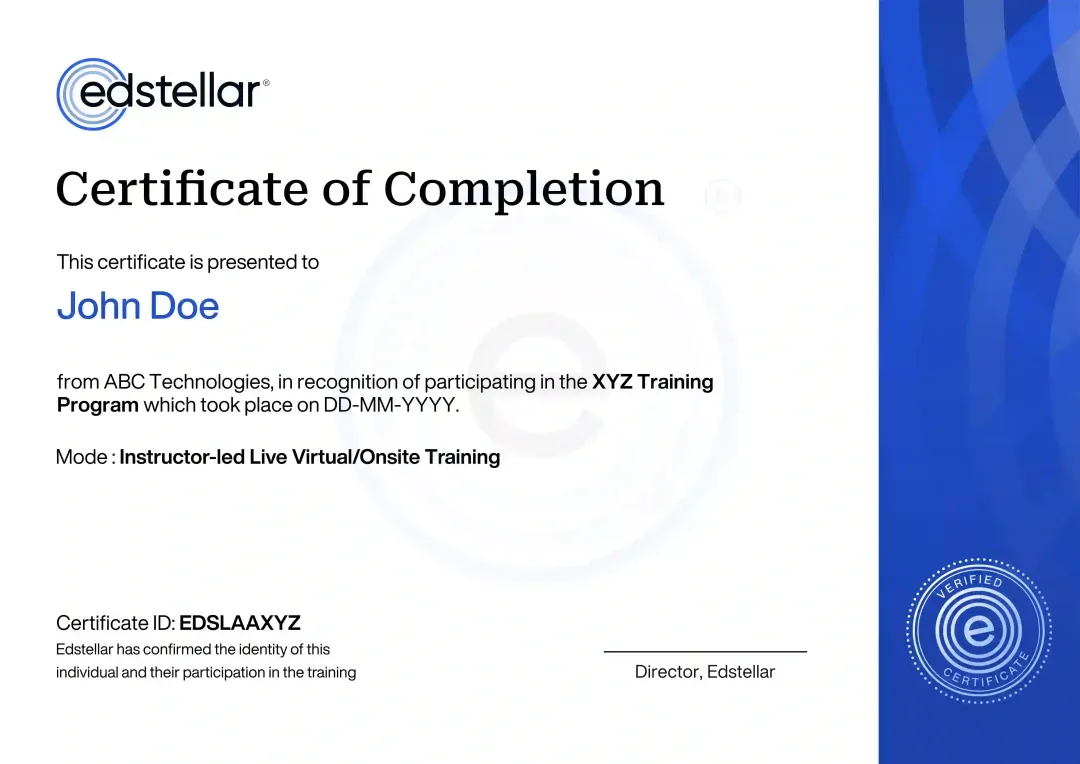
Certificate of Training Completion.
On successful completion, employees receive an Edstellar course completion certificate, recognizing their commitment to ongoing learning and professional development. It validates the skills they have built and motivates them to keep growing and contribute to organizational success.
Earned, not attended. Awarded on completion of all hands-on labs and the capstone project.
Training Delivery Modes: Onsite, Virtual and Hybrid
Choose how your team learns Data Visualization and D3.js: every mode keeps the same curriculum, labs, and instructor coaching.
Data Visualization and D3.js Onsite Training
Instructor-led Data Visualization and D3.js training at your offices, with labs set up on your tools. The instructor pairs with the team in person and tunes exercises to your workflows.
- Instructor-led Data Visualization and D3.js training at your offices
- Labs set up on your tools and workflows
- In-person coaching and reviews
- Exercises tuned to your stack

Data Visualization and D3.js Live Virtual Training
Live virtual Data Visualization and D3.js sessions on Zoom or Teams with the same labs, breakout practice, and instructor coaching as onsite delivery.
- Live virtual Data Visualization and D3.js sessions on Zoom or Teams
- Same guided labs as onsite delivery
- Breakout practice with instructor coaching
- Session recordings for later review

Data Visualization and D3.js Hybrid Training
Instructor-led Data Visualization and D3.js training delivered hybrid, onsite, or live virtual. Every session blends concise instruction with guided labs on your stack.
- Live instruction across onsite and virtual Data Visualization and D3.js sessions
- Guided labs with instructor coaching throughout
- Real Data Visualization and D3.js workflows, not slideware
- Flexible scheduling without losing live interaction

Need a Customized Training Format That Works for Your Team?
Our training delivery is customized to your team's schedule, full days, half days, sessions spread across weeks, or modular formats. Share your preferred timeline, and we'll plan the training around it.
Frequently Asked Questions
Edstellar connects visual communication with the code needed to build custom interactive charts. Analysts, frontend developers, and BI colleagues work from a brief to a visualization, helping the organization review both technical behavior and whether the display explains the data accurately.
The program combines D3 implementation with chart selection, interaction, accessibility, and storytelling. Its capstone includes design iteration and user-testing concepts, so a visualization is reviewed for usefulness rather than novelty alone.
Edstellar brings Data Visualization and D3.js training to enterprise teams through a network of 5,000+ vetted trainers and coaches, built on work with 200+ enterprise clients in 100+ countries. Developed with visualization developers who use D3.js, it focuses on data binding, scales, SVG charts and interaction. Trainers are screened for subject expertise, industry experience and facilitation quality, and exercises can be built around your tools and use cases. Training runs onsite, virtual or hybrid, and pre- and post-training assessments track skill gains.
Organizations requiring custom, interactive data displays can use the training. It supports analytics, BI, and frontend teams that need to coordinate data interpretation, chart design, browser implementation, and stakeholder communication.
Look for sound chart reasoning, practical D3 skills, interaction design, and accessibility awareness. Edstellar combines these in a reviewed visualization project. Compare the trainer and exercises with your datasets, web stack, and the decisions the visuals should support.
Question Not Answered Here?
Put it in the request. A training specialist answers it directly, within one business day.
Where this Training Fits in Your Team’s learning path.
Data Visualization and D3.js sits in the middle of your Data Analytics & Business Intelligence learning path: foundations before, deeper practice after.

LEARN JAVASCRIPT
JavaScript Training
Write JavaScript fluently, including data structures, functions and DOM work, which D3 relies on.

VISUALISATION BASICS
Data Analytics & Visualization Training
Learn chart selection and visual design principles before coding any custom visualisation.

BUILD WITH D3
Data Visualization and D3.js Training
Bind data to SVG and build custom, interactive D3 visuals that standard chart tools cannot produce.

TELL THE STORY
Data Storytelling & Infographic Design Training
Place custom D3 visuals inside a clear narrative that explains the data to its audience.
More related courses
ECharts Training
TypeScript Training
Visual Communication Training
Why Choose Edstellar as Your Data Visualization and D3.js Corporate Training Provider
Edstellar delivers Data Visualization and D3.js corporate training for global enterprises: tailored curriculum, expert trainers, labs-based learning, and measurable outcomes your L&D team can report.

EXPERT TRAINERS
YEARS DELIVERING
ORGANIZATIONS TRAINED
CERTIFIED
Tailored
Every cohort's labs, examples, and exercises are tuned to your Data Visualization and D3.js stack and workflows.
Proven Methodology
Concise instruction followed by guided labs and reviews, a repeatable method that builds real Data Visualization and D3.js skill.
Practice-Based Learning
5 modules of labs and a capstone keep your team doing Data Visualization and D3.js work, not just hearing about it.
Expert Trainers
Practitioners who do Data Visualization and D3.js work in production lead every session and review your team's labs.
Global Scale
One consistent Data Visualization and D3.js program delivered across your offices worldwide, in 10+ languages.
Measurable Outcomes
Lab checkpoints and a capstone review prove Data Visualization and D3.js skill gains you can report internally.
Also from Edstellar
Talent assessments
Psychometric, behavioral, leadership and 360-degree assessment.
→Training needs analysis
Needs analysis, gap identification, and a training roadmap.
→L&D consulting
Learning strategy, content, technology and ROI measurement.
→OD consulting
Org design, succession planning and cultural change.
→Managed training services
Training outsourcing, vendor management, logistics and administration.
→Coaching solutions
Executive and manager coaching that keeps skills in use.
Start an RFP shaped to your needs.
Answer three quick questions about team size, scope, and how often you need the program run, then send the request from the last step. Everything you choose travels with it, so you only fill this in once.
How many team members need training?
Data Visualization and D3.js Training Packages & Pricing
Where L&D holds an annual budget, license packages price the whole year at once instead of raising a purchase order per workshop. Hours and licenses are pooled across teams, programs and locations, so unused capacity is not stranded in one department.
Starter
120
trainee licenses64 hours of group training
Tailored for SMBs
Growth
320
trainee licenses160 hours of group training
Ideal for growing SMBs
Enterprise
800
trainee licenses400 hours of group training
Designed for large corporations
Custom
Unlimited
trainee licensesDuration set by the rollout
Multi-region and multi-year
Training Packages & Pricing
Choose the training format that works for your team. Pricing is customized based on your requirements, cohort size, and delivery needs.
Request a Quote for Data Visualization and D3.js Training for Your Team
Share your team size, Data Visualization and D3.js goals, and timelines to receive a tailored training plan and quote. Book a discovery call to discuss your needs; we confirm availability and respond with a proposal.