Corporate Data Visualization with Python Training Course

Edstellar’s instructor-led Data Visualization with Python course equips professionals with the skills to turn complex data into compelling visual narratives. The training delves into Python's powerful libraries, such as Matplotlib and Seaborn, teaching professionals to craft interactive charts and dashboards.

32 - 40 hrs
Instructor-led (On-site/Virtual)
Language
English
Enquire Now
Data Visualization with Python Training

Drive Team Excellence with Data Visualization with Python Training for Employees

Empower your teams with expert-led on-site/in-house or virtual/online Data Visualization with Python Training through Edstellar, a premier corporate training company for organizations globally. Our tailored Data Visualization with Python corporate training course equips your employees with the skills, knowledge, and cutting-edge tools needed for success. Designed to meet your specific needs, this Data Visualization with Python group training program ensures your team is primed to drive your business goals. Transform your workforce into a beacon of productivity and efficiency.

Data Visualization with Python refers to representing data through graphical or visual formats using Python, a popular programming language known for its ease of use and powerful libraries. This approach is critical for teams aiming to make data-driven decisions and communicate complex information in an accessible manner. The training encapsulates the importance of visual data representation in modern business environments, highlighting why it's an indispensable skill across industries.

Edstellar instructor-led Data Visualization with Python training course stands out due to its unique delivery and customization options. Offering both virtual and onsite Data Visualization with Python training, Edstellar caters to diverse learning preferences and organizational needs. What sets this instructor-led training apart is its emphasis on practical experience, ensuring professionals engage directly with data visualization projects tailored to their specific context. This hands-on approach is complemented by the course's ability to be customized, allowing content to be aligned with each organization's unique challenges and goals.

Key Skills Employees Gain from Data Visualization with Python Training

Data Visualization with Python skills corporate training will enable teams to effectively apply their learnings at work.

  • Compelling Data Visualization
  • Complex Data Interpretation
  • Best Practices Application
  • Customized Visual Solutions
  • Python Visualization Libraries
  • Dynamic Chart Generation

Data Visualization with Python Training for Employees: Key Learning Outcomes

Edstellar’s Data Visualization with Python training for employees will not only help your teams to acquire fundamental skills but also attain invaluable learning outcomes, enhancing their proficiency and enabling application of knowledge in a professional environment. By completing our Data Visualization with Python workshop, teams will to master essential Data Visualization with Python and also focus on introducing key concepts and principles related to Data Visualization with Python at work.


Employees who complete Data Visualization with Python training will be able to:

  • Create compelling and informative visual representations of data to support business decisions
  • Interpret complex data sets and translate them into clear, visual formats that can be easily understood by stakeholders
  • Apply best practices in data visualization to enhance the storytelling aspect of data analysis, making it more engaging and accessible
  • Develop customized visual solutions to address specific organizational challenges, enabling a data-driven approach to problem-solving
  • Utilize Python's powerful visualization libraries, such as Matplotlib and Seaborn, to generate dynamic charts, graphs, and interactive dashboards

Key Benefits of the Data Visualization with Python Corporate Training

Attending our Data Visualization with Python classes tailored for corporations offers numerous advantages. Through our on-site/in-house or virtual/online Data Visualization with Python training classes, participants will gain confidence and comprehensive insights, enhance their skills, and gain a deeper understanding of Data Visualization with Python.

  • Upskill your teams in advanced data visualization strategies, including interactive dashboards and data storytelling, to drive insights and action
  • Learn the fundamentals of data visualization techniques and best practices, enabling professionals to communicate complex information effectively
  • Knowledge gained from hands-on exercises and real-world projects during the training ensures a practical understanding of data visualization concepts
  • Equip team with the skills to use Python's leading visualization libraries, such as Matplotlib and Seaborn, for creating dynamic and impactful visual stories
  • Develop a deep understanding of how to interpret and analyze data through visual representations, enhancing decision-making processes within your organization

Data Visualization with Python Training Topics and Outline

Our virtual and on-premise Data Visualization with Python training curriculum is divided into multiple modules designed by industry experts. This Data Visualization with Python training for organizations provides an interactive learning experience focused on the dynamic demands of the field, making it relevant and practical.

  1. Understanding data visualization
    • The importance of visual data representation
    • Overview of data visualization tools
  2. Python for data visualization
    • Introduction to Python libraries
    • Setting up the environment
  1. Visualizing with Matplotlib
    • Basics of matplotlib
    • Plotting with matplotlib
  2. Exploring Seaborn for statistical data visualization
    • Getting started with Seaborn
    • Advanced plotting with seaborn
  3. Utilizing other specialized tools
    • Introduction to pandas plotting
    • Exploring additional libraries
  1. Interactive visualizations with Plotly
    • Basics of Plotly
    • Creating interactive charts with Plotly
  2. Working with geospatial data
    • Introduction to geospatial visualization
    • Using geopandas and folium for mapping
  1. Introduction to Dash
    • Getting started with dash
    • Building blocks of a dash app
  2. Designing and deploying Dash apps
    • Designing a dash layout
    • Deploying dash applications

This Corporate Training for Data Visualization with Python is ideal for:

What Sets Us Apart?

Data Visualization with Python Corporate Training Prices

Our Data Visualization with Python training for enterprise teams is tailored to your specific upskilling needs. Explore transparent pricing options that fit your training budget, whether you're training a small group or a large team. Discover more about our Data Visualization with Python training cost and take the first step toward maximizing your team's potential.

Request for a quote to know about our Data Visualization with Python corporate training cost and plan the training initiative for your teams. Our cost-effective Data Visualization with Python training pricing ensures you receive the highest value on your investment.

Request for a Quote

Our customized corporate training packages offer various benefits. Maximize your organization's training budget and save big on your Data Visualization with Python training by choosing one of our training packages. This option is best suited for organizations with multiple training requirements. Our training packages are a cost-effective way to scale up your workforce skill transformation efforts..

Starter Package

125 licenses

64 hours of training (includes VILT/In-person On-site)

Tailored for SMBs

Most Popular
Growth Package

350 licenses

160 hours of training (includes VILT/In-person On-site)

Ideal for growing SMBs

Enterprise Package

900 licenses

400 hours of training (includes VILT/In-person On-site)

Designed for large corporations

Custom Package

Unlimited licenses

Unlimited duration

Designed for large corporations

View Corporate Training Packages

Data Visualization with Python Course Completion Certificate

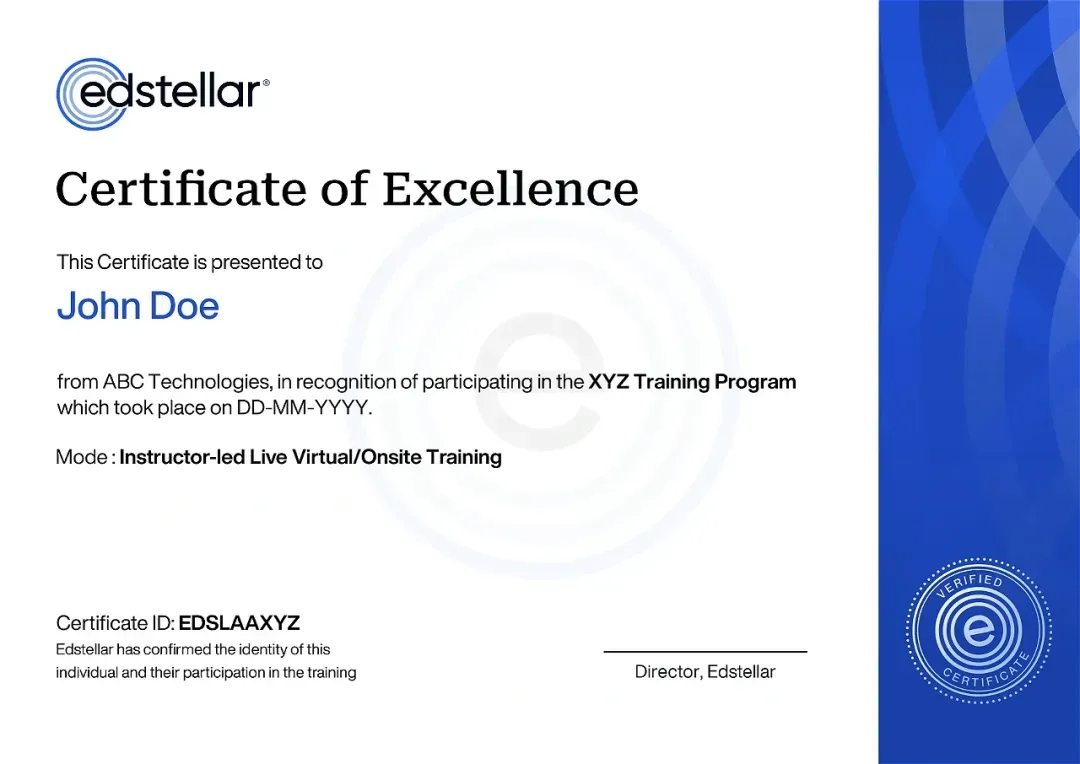
Upon successful completion of the Data Visualization with Python training course offered by Edstellar, employees receive a course completion certificate, symbolizing their dedication to ongoing learning and professional development. This certificate validates the employees' acquired skills and serves as a powerful motivator, inspiring them to further enhance their expertise and contribute effectively to organizational success.

Target Audience for Data Visualization with Python Training Course

The Data Visualization with Python training course is ideal for data analysts, business analysts, and data scientists.

The Data Visualization with Python training program can also be taken by professionals at various levels in the organization.

Data Visualization with Python training for managers

Data Visualization with Python training for staff

Data Visualization with Python training for leaders

Data Visualization with Python training for executives

Data Visualization with Python training for workers

Data Visualization with Python training for businesses

Data Visualization with Python training for beginners

Data Visualization with Python group training

Data Visualization with Python training for teams

Data Visualization with Python short course

Prerequisites for Data Visualization with Python Training

Professionals should have a basic understanding of Python programming and fundamental data analysis concepts to take the Data Visualization with Python training course.

Assess the Training Effectiveness

Bringing you the Best Data Visualization with Python Trainers in the Industry

The instructor-led Data Visualization with Python training is conducted by certified trainers with extensive expertise in the field. Participants will benefit from the instructor's vast knowledge, gaining valuable insights and practical skills essential for success in Data Visualization with Python Access practices.

No items found.

Request a Training Quote

This is some text inside of a div block.
Valid number
This is some text inside of a div block.
Thank you! Your submission has been received!
Oops! Something went wrong while submitting the form.

Training Delivery Modes for Data Visualization with Python Group Training

At Edstellar, we understand the importance of impactful and engaging training for employees. To ensure the training is more interactive, we offer Face-to-Face onsite/in-house or virtual/online Data Visualization with Python training for companies. This method has proven to be the most effective, outcome-oriented and well-rounded training experience to get the best training results for your teams.

Virtuval
Virtual

Instructor-led Training

Engaging and flexible online sessions delivered live, allowing professionals to connect, learn, and grow from anywhere in the world.

On-Site
On-Site

Instructor-led Training

Customized, face-to-face learning experiences held at your organization's location, tailored to meet your team's unique needs and objectives.

Off-Site
Off-site

Instructor-led Training

Interactive workshops and seminars conducted at external venues, offering immersive learning away from the workplace to foster team building and focus.

Other Related Corporate Training Courses

24 - 32 hrs
Instructor - led (Onsite or Virtual)
16 - 24 hrs
Instructor - led (Onsite or Virtual)
16 - 24 hrs
Instructor - led (Onsite or Virtual)
16 - 24 hrs
Instructor - led (Onsite or Virtual)
16 - 24 hrs
Instructor - led (Onsite or Virtual)
24 - 32 hrs
Instructor - led (Onsite or Virtual)
24 - 30 hrs
Instructor - led (Onsite or Virtual)
16 - 22 hrs
Instructor - led (Onsite or Virtual)
16 - 24 hrs
Instructor - led (Onsite or Virtual)
8 - 12 hrs
Instructor - led (Onsite or Virtual)