Benchmarking is about more than numbers. It’s about patterns, the quiet signals hidden in data that reveal how people, methods, and technology shape impact. Every number tells a story from the past, but great leaders don’t study history to admire it; they study it to anticipate what’s next.
That’s where today’s L&D inflection point begins. Skill gaps are widening, AI adoption remains uneven, and markets are shifting faster than talent strategies can adapt.
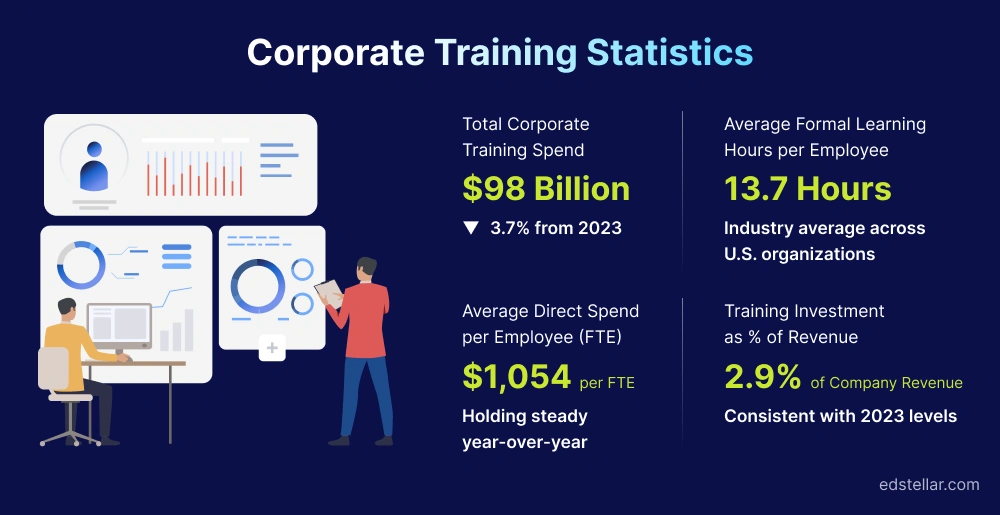
Learning leaders are no longer operating in the background; they’re facing questions at the very center of boardroom conversations. When the CFO asks, “Why are we spending $1,200 per employee when the industry average is $1,054?” or the CEO presses, “How quickly are we making new hires productive compared to our peers?”, belief in learning’s value isn’t enough anymore. You need evidence. You need benchmarks.
And the data already sets the tone for that conversation.
In 2024, U.S. companies spent nearly $98 billion
on training, a 3.7% dip from the previous year. Employees received just 13.7 hours of formal training on average, while direct spend held steady at $1,054 per FTE, or roughly 2.9% of revenue.
These figures aren’t distant statistics; they’re mirrors. They show how your organization’s investments, priorities, and performance stack up against the world’s learning leaders. They determine whether your efforts are ahead of or lagging behind the curve.
That’s why L&D benchmarking matters more than ever. It’s not about looking backward; it’s about using credible, comparative data to look ahead with confidence. It’s what separates teams that defend learning as a cost from those that position it as a strategic capability for business survival.
Without clear benchmarks, even the most visionary L&D function risks being sidelined in the very rooms where the future of talent strategy is decided.
TL;DR
Benchmarking is how L&D secures resources, prioritizes investments, and demonstrates impact by comparing performance to trusted peer sets.
Use a layered metric set (investment, reach, capability, impact, operations) and normalize by size, region, and industry.
Start with a lightweight survey and a scoring rubric to visualize gaps, pick 3–5 quarterly focus areas, and run a 90-day improvement cadence.
Current markers: U.S. training spend ~$98B (2024); formal hours per employee 13.7 (2024); direct spend ~$1,054/FTE; revenue ratio ~2.9%.
What to Benchmark: A Practical Enterprise Metric Set
According to the LinkedIn Economic Graph, skill sets for jobs have changed by nearly 25% since 2015 and are projected to double by 2027. In this era of rapid skill volatility, benchmarking must be designed for both breadth (executive visibility) and depth (team-level actionability).
To achieve this, adopt an enterprise-grade metric set that captures investment, reach, capability, impact, and operations.
Metric Category
Key Metrics
Why it Matters
Investment & Efficiency
1. L&D spend per employee
2. L&D spend as % of revenue
3. L&D FTE per 1,000 employees
4. Cost per learning hour
5. % external vendor spend
Frame's affordability, sourcing mix, and scale against peers.
Reach & Engagement
1. Learning hours per employee
2. Participation rate
3. Completion rate
4. Monthly active learners
5. Learning CSAT/NPS
Demonstrates that learning programs reach employees at scale and are valued by participants.
Capability & Mobility
1. Critical skills coverage
2. Skills gap index
3. Time to proficiency
4. Internal mobility rate
5. Certification attainment
Shifts the conversation from “courses” to capability building and career growth.
Translates learning outcomes into operational and financial impact.
Operations & Digital Enablement
1. Program launch lead time
2. % learning in the flow of work (Teams/Slack/CRM)
3. Personalization coverage
4. GenAI-assisted content share (with governance)
Highlights L&D’s agility, relevance, and digital maturity.
Peer Sets: How to Compare Apples with Apples
Benchmarking only delivers value when you’re comparing yourself to the right peers. A single “industry average” can often be misleading, as it flattens the nuances that make organizations unique. To get meaningful insights, build your peer sets through multiple lenses that mirror how your company truly operates.
Industry: Training budgets in regulated industries like financial services or healthcare differ sharply from those in SaaS or manufacturing. Comparing across these categories distorts the picture of efficiency and investment.
Company Size: Small, mid, and large enterprises vary widely in learning hours per employee and spend per FTE. Scale influences how budgets stretch and how programs are delivered.
Region: Benchmarks across APAC, EMEA, and North America reflect distinct cultural expectations, compliance requirements, and budget priorities, all of which shape how learning is funded and consumed.
Digital Intensity/Operating Model: A field-heavy workforce has different learning needs than a desk-based one. Similarly, platform maturity, whether you rely on an LMS, LXP, or DAP, directly impacts delivery speed, engagement, and data visibility.
Strategy Maturity: Organizations with defined skill taxonomies, mobility frameworks, and AI-enabled learning strategies benchmark at a different level than those still digitizing their approach.
Maintain Two Peer Sets for Balanced Benchmarking:
Primary Peers: The closest comparable organizations; the same industry, size, and region. These provide realistic, board-ready benchmarks grounded in operational reality
Aspirational Peers: High-maturity or digitally advanced organizations that are ahead of you on the curve. These set ambitious targets and inspire strategic leaps.
The Survey Kit and Scoring Rubric: How to Put It to Work
The value of benchmarking lies in how you operationalize it. This survey kit and scoring rubric are designed to help you move from raw data to actionable insight consistently, accurately, and collaboratively.
1. Distribute the Survey to the Right Owners: Share the template with L&D, HRIS, Finance, and Operations so each function inputs data for its respective domain. Every field comes with clear definitions and data sources, ensuring no confusion over what “learning hours” or “spend per FTE” actually mean.
2. Normalize your Data for Fair Comparisons: Express results in per-employee or percentage terms to enable comparison between a 500-person firm and a 50,000-person enterprise. Use a Trailing Twelve Months (TTM) view to neutralize one-time spikes and seasonal variations.
3. Score your Performance: For each metric, rate yourself as Poor, Baseline, Competitive, or Leading. The built-in rubric applies weights automatically, allowing you to analyze both category-level scores and your overall composite index.
4. Prioritize What Matters Most: Don’t chase every gap. Focus on the three to five areas that drive the greatest business impact. For example, if headcount is doubling, reduce time-to-proficiency; if retention is falling, improve internal mobility.
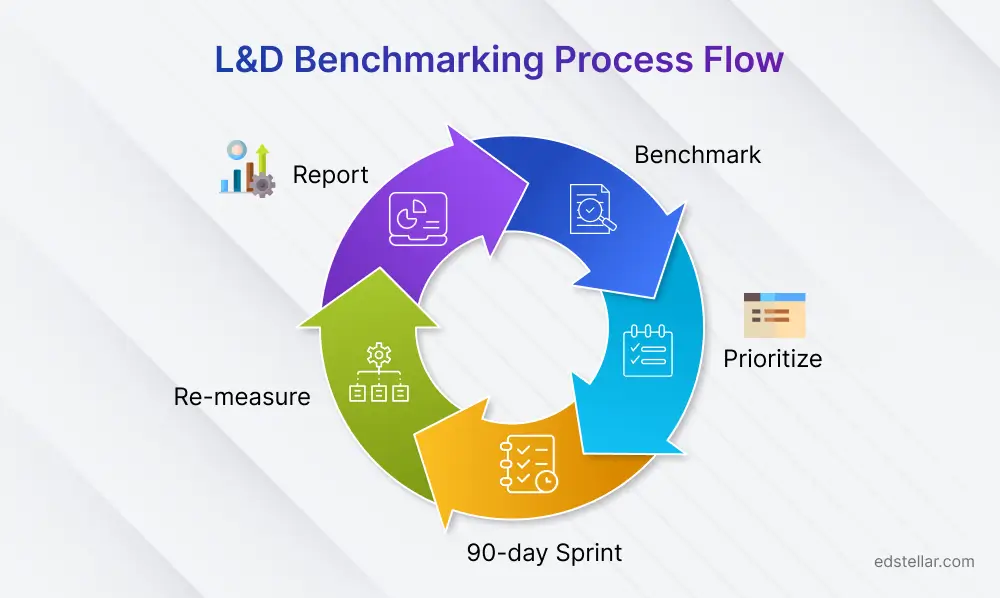
5. Run a 90-Day Improvement Sprint: Assign clear owners, execute targeted interventions, and re-measure using the same rubric. This turns benchmarking into a continuous improvement cycle rather than a one-off report.
Benchmark Survey + Scoring Rubric (Excel)
Benchmark Survey + Scoring Rubric - Ready to customize with your peer thresholds and weights.
Survey Sheet: Metric IDs, definitions, formulas, and input fields for your organization’s data.
Scoring Rubric: Editable thresholds and weights that generate a composite index trackable quarter over quarter.
Setting Targets with Realistic Anchors
Setting learning targets without context is like navigating without a compass. Public benchmarks give you direction, but they need to be anchored in the realities of your organization.
Start with credible external data, then refine it using your own peer-set insights to make each target truly actionable.
Learning Hours Per Employee: ATD data shows employees averaged 13.7 formal learning hours in 2024. For digitally mature, desk-based organizations, a more ambitious range of 21–35 total hours (formal + informal) is realistic, especially when supported by in-flow learning experiences.
Direct Spend Per Employee: The baseline remains around $1,054 per FTE. Treat this as a starting floor, then adjust according to your context. Regulated sectors such as finance and healthcare often invest more, while lean-margin industries may optimize spend differently.
Learning Spend as a % of Revenue: Traditional organizations should allocate 1–2% of revenue to learning, while transformation-intensive or capability-driven businesses benefit from investing 2% or more. According to ATD’s 2024 benchmark, the average sits at 2.9%.
Career-Driven Learning Pays Off:
Career-driven learning pays off: Organizations that are “career development champions” are 42% more likely to be frontrunners in GenAI adoption, and report higher confidence in profitability and talent attraction/retention.
In 2024, spending on external learning products and services increased by 23% year over year. This reflects a clear shift toward blended delivery models combining in-house programs with external vendors to balance quality, specialization, and scalability.
Example: Translating Benchmarks into a 90-Day Plan
Consider a 5,000-employee SaaS company based in APAC. The L&D team has just completed its baseline survey and identified three critical performance gaps:
Monthly Active Learners (MAL): Only 28% of employees engage with learning each month.
Time-to-Proficiency (TTP): New hires need 120 days to become fully productive.
Personalization Coverage: Just 15% of the workforce receives learning that feels role- or skill-specific.
These numbers tell a clear story: the organization must boost engagement, accelerate ramp-up time, and personalize learning at scale.
So what should they do?
1. Set 90-Day Targets
The L&D team establishes realistic yet ambitious goals using public benchmarks and peer-set data as anchors:
MAL: Increase engagement from 28% → 40% by embedding learning into everyday tools and using timely nudges.
TTP: Reduce ramp-up time from 120 days → 90 days with structured, role-based learning paths and active manager involvement.
Personalization: Expand tailored learning from 15% → 40%, powered by audience segmentation and the skills graph in their LXP.
2. Design the Moves to Get There
With targets defined, the team builds a focused 90-day action plan:
Boost Engagement: Integrate micro-learning directly into Teams and CRM. Employees encounter short, contextual content triggered by workflow events, making learning timely, relevant, and unavoidable.
Accelerate Proficiency: Launch structured “Day 0 → Day 90” journeys for five critical roles. Equip managers with 10-minute weekly coaching kits to reinforce learning on the job.
Scale Personalization: Use the LXP’s skills graph to match content to each learner’s role, skills, and career path, ensuring every interaction feels tailored.
3. Modernize Content Creation
To sustain speed and relevance, the content team leverages Generative AI for course production.
Draft: Use GenAI to generate initial outlines and module structures.
Refine: Have subject-matter experts review and polish for accuracy and instructional integrity.
Track: Measure progress with a new KPI AI-assisted content share to quantify innovation in content development.
4. Run the Sprint and Re-measure
The 90-day sprint begins with clear ownership for each metric and weekly progress tracking. At quarter’s end, the team reruns the survey and scoring rubric, comparing outcomes against both the baseline and peer sets.
Governance: Make Benchmarking a Habit (Not a Project)
The value of benchmarking emerges when it becomes part of your operating rhythm. Treat it as a management habit, a quarterly ritual that drives alignment, accountability, and agility across the organization.
Quarterly: Re-run the benchmark survey every three months, update your scores, and publish a concise one-page scorecard. This cadence keeps leaders and stakeholders consistently informed about progress, gaps, and ROI trends.
Biannual: Twice a year, adjust thresholds if peer-set benchmarks evolve, for instance, when industry averages rise or technology adoption accelerates. At the same time, review metric weightings with Finance and HR Business Partners to ensure they still mirror current business priorities.
Annual: Once a year, step back and revalidate the entire benchmarking framework. Realign metrics and targets with major business changes such as platform rollouts, mergers, or new product lines.
Data Hygiene: Maintain consistency and credibility in your inputs, headcount, revenue, learning hours, and other core data points. Document every assumption clearly so your numbers remain trusted, traceable, and repeatable.
Common Benchmarking Pitfalls and How to Fix Them
Even the most well-intentioned benchmarking efforts can lose their value when key principles are overlooked.
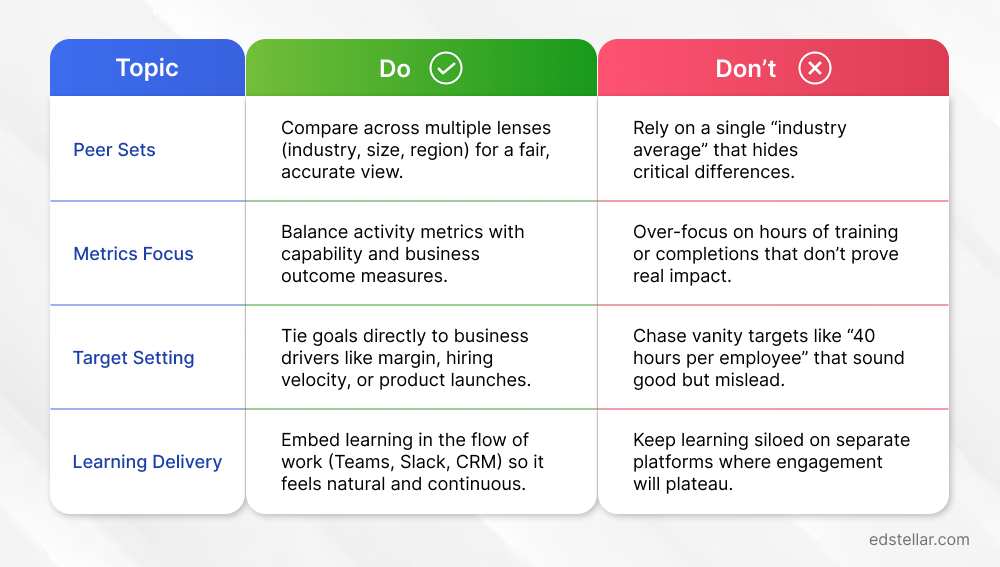
Here are four common traps and how to avoid them.
1. Using only One Peer Set: Always evaluate performance through multiple lenses: industry, size, and region to ensure a fair and contextualized benchmark.
2. Over-Focusing on Activity Metrics: Tracking hours of training or course completions can look impressive, but they rarely prove true learning impact. Balance activity data with outcome metrics that reflect skills gained, proficiency improvements, and business results.
3. Chasing Vanity Targets: Targets that sound good on paper, such as “40 hours of training per employee,” can mislead teams if they are not tied to strategic goals. Anchor every KPI to a tangible business driver, like margin growth, hiring velocity, or product readiness.
4. Ignoring Flow-of-Work Delivery: When learning lives on separate platforms, engagement drops. Integrating learning into daily tools like Teams, Slack, or CRM makes it a natural, continuous part of work, not an extra task.
Making L&D Benchmarking Work for Your Business
Benchmarking only matters when it drives meaningful action. At Edstellar, we help organizations turn metrics into movement, translating insights into stronger strategies, smarter decisions, and measurable business outcomes.
We work alongside L&D teams to co-design benchmarking frameworks and learning strategies that reflect their real operating environment, not generic industry templates. Through data-backed Training Needs Analysis and L&D Consulting, we help you identify the metrics that truly define performance, and align them with business priorities.
Once the strategy is clear, we bring it to life through Skills Intelligence and Career Frameworks. Using Edstellar’s Skills Matrix, organizations can make workforce capabilities visible, identify critical gaps, and enable internal mobility with precision.
And because strategy without execution changes little, our Managed Training Services ensure scalable delivery onsite or virtual that accelerates time-to-proficiency and embeds learning seamlessly into the flow of work.
In a world where learning is under constant scrutiny, we stand beside L&D leaders who want to benchmark smarter, build credibility with data, and prove that learning is not a cost center, it’s a strategic growth engine.
If that’s the journey you’re on, Edstellar is your partner in getting there.
Frequently Asked Questions
What’s the minimum viable benchmark pack?
A minimum viable L&D benchmark pack should include 7 core metrics that give both efficiency and outcome visibility:
Spend per FTE (direct investment in learning)
Hours per employee (formal learning time)
Participation rate (engagement)
Critical skills coverage (capability depth)
Time-to-proficiency (speed to productivity)
Internal mobility rate (career outcomes)
One business outcome metric (such as productivity lift or retention impact)
These benchmarks create a balanced baseline without overwhelming your team, and they align with ATD and Training Magazine anchors for credibility.
How do I handle informal learning?
Informal learning should be tracked with proxies rather than ignored. Instead of trying to measure it in the same way as formal training, capture signals such as:
Knowledge base views
In-tool learning prompts
Discussion forum or community activity
Keep informal learning separate from formal learning metrics, but report them side by side for a complete picture. Label them clearly so stakeholders understand the difference. This approach acknowledges that informal learning drives value while keeping benchmarks consistent and defensible.
How often should we re-benchmark?
Re-benchmarking should follow a regular cadence to stay relevant and useful:
Quarterly: Update operating metrics such as participation, engagement, and time-to-proficiency.
Rolling 12 Months: Track stability for spend per FTE and learning hours.
Annual review: Realign thresholds and weights if your strategy, industry, or peer sets change.
This rhythm ensures benchmarking stays a habit, not a project, giving leaders reliable data for board discussions, budget planning, and continuous improvement.
Explore High-impact instructor-led training for your teams.
Unlock premium resources, tools, and frameworks designed for HR and learning professionals. Our L&D Hub gives you everything needed to elevate your organization's training approach.

.svg "edstellar")


.svg)
.svg "Click Here to Follow on Medium")