Beyond Task Counting: Modern Productivity Metrics That Matter

.svg "edstellar")


In many organizations today, time feels like the scarcest resource. Managers are pulled in every direction, handling deliverables, supporting team members, navigating shifting priorities, and keeping up with business demands. But with shrinking bandwidth and mounting pressure to “do more with less,” even experienced leaders struggle to maintain visibility into what’s actually driving team performance.
According to Gartner’s survey, 75% of HR leaders acknowledge that managers are overwhelmed, while 70% report their current leadership programs aren’t preparing managers for the future. Capterra’s research further echoes this reality, with 53% of middle managers saying they don’t have enough time each week for coaching, and 51% struggling to spend meaningful time with their direct reports.
The result? Limited time for reflection, rising decision fatigue, and little clarity on what’s working, and what’s not. As workloads pile up, many leaders turn to productivity metrics not out of preference, but out of necessity. Metrics become a way to make the invisible visible: to understand how teams are functioning, where talent is stretched too thin, and what interventions might actually improve outcomes.
Meanwhile, the stakes for inaction are high. Gallup’s report that the global employee engagement is at a low 21%, contributing to an estimated $438 billion loss in productivity. HR leaders, team managers, and executives alike need tangible ways to identify performance trends, detect burnout risks, and align team efforts with business priorities.
“Measuring productivity isn’t just a box to check it’s critical for improving efficiency and optimizing workflows. When you track productivity metrics, you gain valuable insights into team performance, identify bottlenecks, and make data-driven decisions. ”


This is where productivity metrics prove indispensable. When chosen wisely and implemented well, they offer more than numbers, they offer clarity. They help teams catch issues early, unlock hidden capacity, and continuously improve performance without burning people out.
In this blog, we explore nine high-impact productivity metrics that go beyond surface-level performance tracking. These metrics help teams gain clarity on workflow dynamics, detect inefficiencies early, and make smarter decisions about time and resource allocation. Just as importantly, we’ll look at how to implement these metrics in a way that strengthens team effectiveness without adding unnecessary reporting burdens.
At their core, productivity metrics are measurable indicators that evaluate how efficiently a team or organization transforms inputs, such as time, skills, and effort, into valuable outputs, like completed deliverables, services provided, or customer outcomes. These metrics help leaders understand not just how much work is getting done, but how well that work aligns with goals, timelines, and resource use.
But measuring productivity has evolved. In today’s complex, hybrid, and knowledge-based work environments, traditional output-per-hour formulas often fail to capture what really drives performance. As Deloitte notes, organizations must now shift from one-dimensional productivity measures to what they call “Productivity+,”a broader, human-centric view that integrates output with purpose, well-being, and culture.
Rather than tracking activity for activity’s sake, Deloitte’s framework encourages teams to ask: Are we working on the right things? Do people feel empowered to contribute meaningfully? Is our time being spent in ways that move the organization forward? In this sense, productivity metrics aren’t just tools for oversight, they’re instruments for visibility, balance, and long-term value creation.
To move beyond guesswork and gut feel, organizations need a clear window into how work is progressing, where energy is being drained, and how teams can be supported to thrive. That’s where productivity metrics come in not just to count outputs, but to reveal patterns in team performance, collaboration, engagement, and time use.
The nine metrics below offer a holistic view covering everything from task flow and time management to employee well-being and innovation capacity. Together, they help leaders guide teams more effectively, rebalance workloads, and build momentum without burning people out.
%20(1)%20(1).webp)
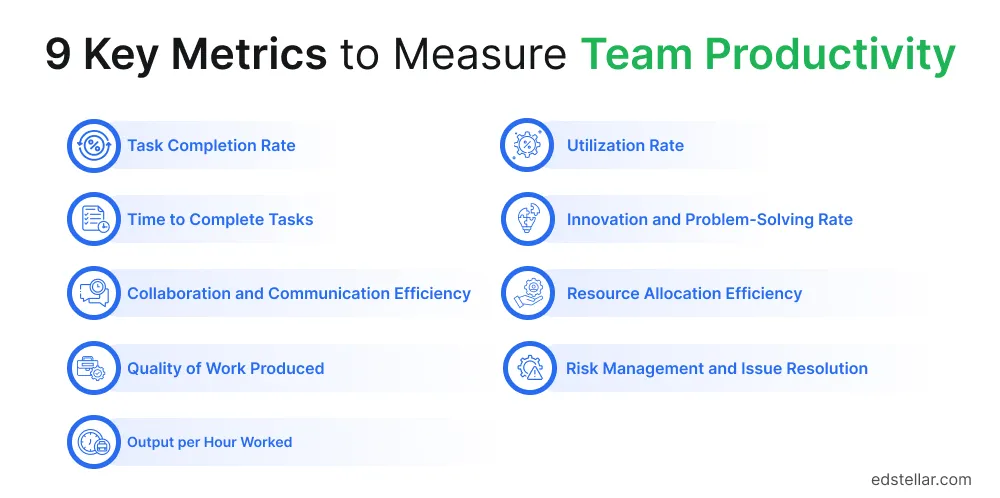
Task Completion Rate (TCR) measures the share of assigned tasks finished on schedule, serving as a basic throughput gauge. It’s calculated as (completed tasks ÷ assigned tasks)×100%. High TCR implies teams meet commitments; a dip often signals misaligned priorities or bottlenecks. For example, defining clear responsibilities and standard processes helps teams hit targets.
When TCR falls, managers can rebalance assignments or clarify scope. Conversely, pushing 100% completion isn’t always feasible if priorities shift or scope grows. Monitoring sustained drops (beyond planned delays) highlights problems early.
In sum, Task Completion Rate is a practical barometer: used judiciously, it reveals workflow gaps and lets leaders adjust staffing or processes before goals slip.
Average task completion time (cycle time) quantifies how long work items take end-to-end. Tracking this reveals workflow speed and bottlenecks. In manufacturing and services, reducing cycle time is a Lean principle; in software, it’s akin to lead time. If simple tasks suddenly lag, a change or obstacle is likely.
This illustrates how measuring and shrinking cycle time can clear bottlenecks and unlock capacity. Over time, plotting cycle-time trends helps set realistic deadlines: historical averages ground commitments. However, teams should balance speed with quality. The goal isn’t arbitrarily beating previous times but smoothing flow.
If the average closure time is 5 days, leaders might run Kaizen events or new tooling to cut that to 3–4 days. In practice, teams use time-to-complete data to streamline processes or automate steps. Thoughtful use of cycle-time metrics thus drives continuous improvement (shortening delays) while ensuring deadlines remain grounded in actual performance.
Collaboration Efficiency gauges how smoothly team members exchange information and coordinate. It’s not a single formula but an index of interaction quality. Firms often track proxies: for example, the share of meetings with clear outcomes, average email/Slack response times, or cross-team project handoff metrics.
Good collaboration (rapid, clear communication and efficient meetings) accelerates work, whereas silos and long email chains slow projects.
Conversely, wasted meetings are a known drag: in a survey, Netflix launched a redesign effort to improve meeting efficiency, cutting the number of meetings by more than 65%, with over 85% of employees favoring the new approach.
In practice, managers watch for quick response rates, constructive stand-ups, and clear handoffs. Some firms use collaboration scores from internal surveys or tool metrics (e.g., code-review turnaround, meeting effectiveness ratings).
Leaders also invest in communication training: better leadership and team-building programs translate into faster decision-making. In short, high collaboration efficiency – marked by decisive meetings and timely knowledge exchange – correlates with faster problem-solving and innovation.
Leadership training also improves this area: for example, courses on leadership communication or team building can sharpen these skills.
Incorporate specific measures like cross-team project completion or reduced rework to capture this metric in practice.
Quality metrics check that output is not only fast but also valuable. Every industry pairs throughput with quality indicators. In manufacturing, firms measure defect rates or “right-first-time” (RFT) percentages, the share of units produced correctly on the first pass, as well as cost-of-poor-quality (COPQ) to capture scrap and rework.
In software development, teams track bugs found post-release or customer-reported errors (e.g., a McKinsey study noted many firms cut defects 20–30% by focusing on quality metrics and developer practices). Service and retail sectors use customer-focused scores: Net Promoter Score, complaint rates, or customer-satisfaction surveys on deliverables.
In healthcare, analogous measures are patient safety events or readmission rates (ensuring no harm while providing care). The key is balancing quantity with excellence: high throughput is hollow if half the work needs redoing. Quality metrics bring this into focus. For instance, Lean manufacturers raise productivity by embedding RFT in operations and aggressively reducing errors.
By routinely measuring defects or satisfaction, teams detect hidden rework loops and tighten processes. In summary, Quality-of-Work metrics act as a check on other metrics: they ensure speed and volume translate into real value. Tracking errors, revision counts, or customer feedback scores directs process improvements and prevents waste alongside productivity gains.
Also known as labor productivity, it divides total output by total labor time to gauge efficiency. In manufacturing, output is units produced; in retail, it may be sales revenue or transactions per labor-hour; in software, features or story points per developer-hour. A rising output/hour means a team achieves more at the same time.
Traditionally, this metric is prominent in manufacturing, where output (e.g., widgets produced) per labor hour directly ties to efficiency, as seen in automotive or electronics production.
A car assembly line producing 50 vehicles in 1,000 hours yields 0.05 vehicles/hour; improvements might target 0.06 vehicles/hour via automation. Variants appear in other industries: in retail, it’s sales per labor hour; in software development, it’s lines of code or features delivered per hour; in healthcare, it’s patients treated per staff hour.
If a retail store generates $10,000 in sales over 200 hours, that’s $50/hour; new tools might raise it to $60/hour.
Tracking output per hour reveals efficiency trends, justifying investments like training or software. Changes, whether from overtime or technology, must be investigated to ensure sustainable gains.
Increasing output per hour often stems from investing in people and processes. Used sensibly, output-per-hour trends justify investments in training or technology (e.g., new software tools or assembly robots) and reveal true efficiency gains. Sustained gains in this metric, without rising defects or burnout, signal healthier productivity.
Utilization rate measures the percentage of work time spent on productive tasks, typically billable work, versus idle or ancillary activities like meetings or admin tasks. In professional services, it’s calculated as billable hours divided by total work hours. According to Asana, the utilization rate is the measure of available time used for billable work, expressed as a percentage. In simpler terms, if a developer is productive 32 hours out of a 40-hour week, utilization is 80%. This metric also offers non-billable teams insight into time spent on high-impact work.
Utilization is vital today due to remote work obscuring productivity, gig economy demands for efficiency, competitive pressures for lean operations, and technology-driven distractions like app-switching. Tracking it optimizes efficiency and well-being by identifying time sinks.
Monitoring utilization enhances resource allocation, ensuring tasks align with team capacity. It improves project planning by highlighting workload imbalances. It also boosts profitability by focusing on high-value tasks, reducing low-impact work like chasing approvals. This drives output and aligns with strategic business goals.
Asana's Anatomy of Work Index found that knowledge workers spend 60% of their time on 'work about work', communicating, searching for information, and managing priorities leaving only 40% for skilled and strategic tasks. Asana warns that if utilization is too high, employees may be overworked.
By reducing “work about work” through automation or streamlined workflows, utilization metrics foster clarity and sustainable performance. Regular reviews keep metrics relevant, ensuring teams stay productive, motivated, and supported.
If it’s too low, resources might be underused. Tracking this metric helps managers balance workloads. For example, a sudden jump in utilization (e.g., from 70% to 90%) may indicate understaffing or overlooked inefficiencies. By normalizing processes (using project management tools, automating reporting, etc.), teams can improve utilization sustainably.
In practice, aim for a stable utilization rate that reflects focus (often 70–80% for knowledge teams) and use dips or spikes to investigate how work is being scheduled.
Innovation rate measures the percentage of successfully implemented ideas or projects out of the total ideas proposed over a time frame. Unlike traditional productivity KPIs, it captures a team’s creativity and problem-solving mindset, driving process efficiencies or new products.
Industries like technology (e.g., software, AI), pharmaceuticals, manufacturing, and consumer goods heavily use this metric. Pharma monitors drug development success, while manufacturing and consumer goods, to optimize processes and innovate products.
Contextually, innovation rate is critical in dynamic markets, ensuring adaptability to customer needs and technological shifts. It fosters creativity, aligning teams with strategic goals. Without it, organizations risk stagnation, missing opportunities, and losing market edge. Neglecting innovation delays growth, and tracking the innovation rate sustains competitiveness and growth. Higher innovation rates signal a dynamic team that stays on the front foot with risk-taking and innovations.
To measure this, teams can track initiatives like new features delivered, process improvements implemented, or creative solutions deployed. For example, an engineering team might count the number of feature ideas taken through to release each quarter.
It’s important to note that a rise in ideas alone isn’t the goal, as success is converting ideas into results. Thus, the innovation rate metric highlights execution: how many good ideas get finished.
While not every team will obsess over innovation rates, including it (or a variant like problem-resolution count) underscores the value of continuous improvement. It reminds leaders to celebrate not just output, but also the quality of output’s evolution.
Resource allocation efficiency measures how effectively teams utilize available resources, including budget, tools, and personnel skills. Indeed, organizations with optimized resource allocation show better productivity outcomes compared to those with poor allocation practices.
Roles like project managers, operations directors, and finance leads most require this metric to balance workloads, optimize budgets, and align skills with tasks. It helps achieve cost savings, improved project timelines, and enhanced team performance by identifying underutilized or overstretched resources, ensuring strategic alignment, and promoting efficiency.
This metric tracks budget utilization rates, tool effectiveness, skill matching, and resource waste reduction. Teams should regularly assess whether resources are aligned with project priorities and strategic goals.
Effective resource allocation prevents both underutilization and overextension, ensuring sustainable productivity levels while maximizing return on investment.
Effective teams proactively identify and resolve potential problems before they impact productivity. Teams with strong risk management practices may experience fewer project delays and lower cost overruns.
This measurement includes risk identification rates, issue resolution times, and preventive action implementation. Teams should track both successful risk mitigation and lessons learned from unexpected challenges.
Strong risk management capabilities enable teams to maintain consistent productivity levels despite external uncertainties and changing project requirements.
This metric measures the average cost incurred by your organization to train new or existing employees. This includes the costs of developing and administering various training programs, such as workshops, seminars, certifications, and other employee development initiatives.
According to Training magazine's 2025 Industry Report, U.S. companies spent an average of $874 per learner on training, with small companies spending $1,091 and large companies spending $468 per employee. Using the metric, you can assess the efficiency and effectiveness of your employee upskilling initiatives. And whether or not they benefit employee productivity over time. Edstellar’s corporate training programs are designed to help organizations optimize this investment with measurable productivity outcomes.
Choosing the right metrics is only half the battle; effective implementation ensures they drive real change. First, align metrics with strategic goals. Each metric should have a clear purpose. For instance, if improving customer experience is a priority, measuring employee engagement or training outcomes (which influence service) makes sense.
Actively involved workers are generally more effective, remain with the organization longer, and make valuable contributions to its success. Monitoring engagement enables businesses to pinpoint and resolve issues impacting motivation, including role structure, management, or workplace conditions.
Managers should explain why a metric is tracked and how it ties to team success. This alignment keeps metrics relevant and actionable.
Second, communicate openly and involve the team. Before rolling out metrics, discuss them with team members: What do they think the numbers mean? This builds trust. Ensure everyone understands how data will be used, as a tool for coaching, not punishment.
For example, if tracking task completion rate, explain it’s to identify process issues, not to penalize slower workers. Employees respond better when metrics are linked to recognition and growth.
Third, invest in training and support. Metrics often reveal new skill needs. If communication efficiency is lagging, consider skills workshops. Many organizations partner with training providers for this. For instance, Edstellar’s leadership and interpersonal courses (such as Team Building Training and Time Management Training) are designed to bolster the underlying skills that metrics measure.
Equipping teams with better tools, whether it’s learning a project-management platform or improving conflict resolution, amplifies the benefits of measurement.
Fourth, use dashboards and regular reviews. Set up simple dashboards or reports so that metrics are visible and updated. Regularly (e.g., weekly or monthly) review trends with the team. A habit of periodic assessments to ensure the metrics you’re tracking are relevant and can provide actionable insights.
If a metric consistently hits the target, consider if that level should be raised or if a new metric is needed. By keeping the set of metrics concise and stable, teams can concentrate on what matters.
Lastly, balance data with context. Numbers don’t speak for themselves. Managers should interpret metrics with qualitative input. For example, a dip in output per hour might coincide with a learning period on new software.
In such cases, celebrate the learning rather than penalize the dip. Gallup emphasizes that engaged employees drive stronger business outcomes across every industry, regardless of company size or economic conditions, so support teams with coaching.
By combining metrics with context and continuous feedback, leaders guide teams to use data as a path to productivity, not a stick.
Even good metrics can mislead if used improperly. Some frequent pitfalls include:
Keep communication positive. For example, view a productivity dip as a signal to provide more training or resources. When employees feel measured with rather than against, they are more likely to engage with the process.
By steering clear of these traps and periodically revisiting your metrics’ effectiveness, organizations ensure their measurements spur productivity improvements rather than unintended consequences.
Productivity metrics, when chosen wisely, are powerful tools for HR leaders, team leads, and executives to drive sustained performance. Beyond tracking output, effective metrics, ike task completion, cycle times, engagement, and innovation, offer a holistic view of team dynamics. Paired with quality checks and people-focused indicators, they guide better practices.
Metrics must align with business goals, be communicated, and be supported by robust development. Edstellar, a global leader in instructor-led corporate training, offers over 2,000 tailored programs in Leadership, Technical, Behavioral, Management, Compliance, and Social Impact.
Tools like our Skill Management Software and Skill Matrix identify skill gaps and personalize learning, ensuring training aligns with metric-driven goals. Programs in Leadership Communication and Time Management boost collaboration and efficiency.
When metrics are tied to employee growth and recognition, engagement rises. Thoughtful metrics, paired with Edstellar’s training and skill management solutions, empower teams to improve efficiency without sacrificing morale. This synergy fuels growth, with engaged teams delivering higher efficiency, quality, and competitive advantage, as experts confirm.
#On-site #Virtual #GroupTraining #Customized
Explore 2000+ industry ready instructor-led training programs.

Create dynamic leaders and cohesive teams. Learn more now!

Do a quick Skill gap analysis with Edstellar’s Free Skill Matrix tool

Unlock premium resources, tools, and frameworks designed for HR and learning professionals. Our L&D Hub gives you everything needed to elevate your organization's training approach.
Access L&D Hub Resources.svg)
.svg "Click Here to Follow on Medium")