.svg "edstellar")


Content
Table of Content
You're being asked to do more with less to deliver growth, manage liquidity risk, report with precision, and still find room to fund innovation. Every forecast you sign off on is being stress-tested against market swings you can't predict. Every investment decision is being judged not just on ROI, but on how resilient it will be when conditions change overnight.
In this new reality, the CFO's role has evolved. You're no longer just the custodian of financials; you're the Value Architect of the enterprise. The one expected to turn volatility into vision, and spreadsheets into strategy. But with that expanded influence comes a new kind of accountability: the need to prove that finance isn't just measuring performance, it's driving it.
And the world is watching. EY's 2024 Institutional Investor Survey found that while 88% of investors have increased their use of ESG information, 92% simultaneously worry that ESG-related initiatives harm short-term corporate performance underscoring the balancing act CFOs must navigate.
The takeaway? You're being measured not only on profit, but on purpose, how well you balance performance with agility, transformation with trust.
As Alysha Randall puts it:
“The best finance KPIs aren't vanity metrics or box-ticking exercises. They should measure how your team truly adds value, how efficient, reliable, and strategic you are in driving the business forward. Well-chosen KPIs don't just track performance; they tell the story of finance as a partner in growth, not just a back-office function.".

Alysha Randall

This isn't another rundown of financial ratios. It's your CFO playbook a practical guide to 24 KPIs that connect your numbers to strategy, your dashboards to decisions, and your reporting to real, measurable impact.
Top 24 CFO KPIs to Measure Financial Performance
To maintain a holistic oversight, CFOs must monitor a diverse array of KPIs spanning profitability, liquidity, efficiency, leverage, and operations. These indicators, rooted in established financial principles, enable benchmarking against industry peers, forecasting trends, and aligning resources with strategic objectives. CFO KPIs can be broadly categorized into five areas: profitability and revenue, liquidity and cash flow, financial efficiency and return, leverage and risk management, and operational efficiency. Here's a comprehensive breakdown.
Profitability & Revenue Metrics
Financial leaders monitor profitability to understand the true earning power of their organization. These metrics reflect growth potential, pricing strategy efficiency, and overall financial health. These metrics help CFOs evaluate how efficiently the organization generates income and sustains profitability. Proper analysis of these KPIs enables strategic decision-making, financial forecasting, and investor confidence.
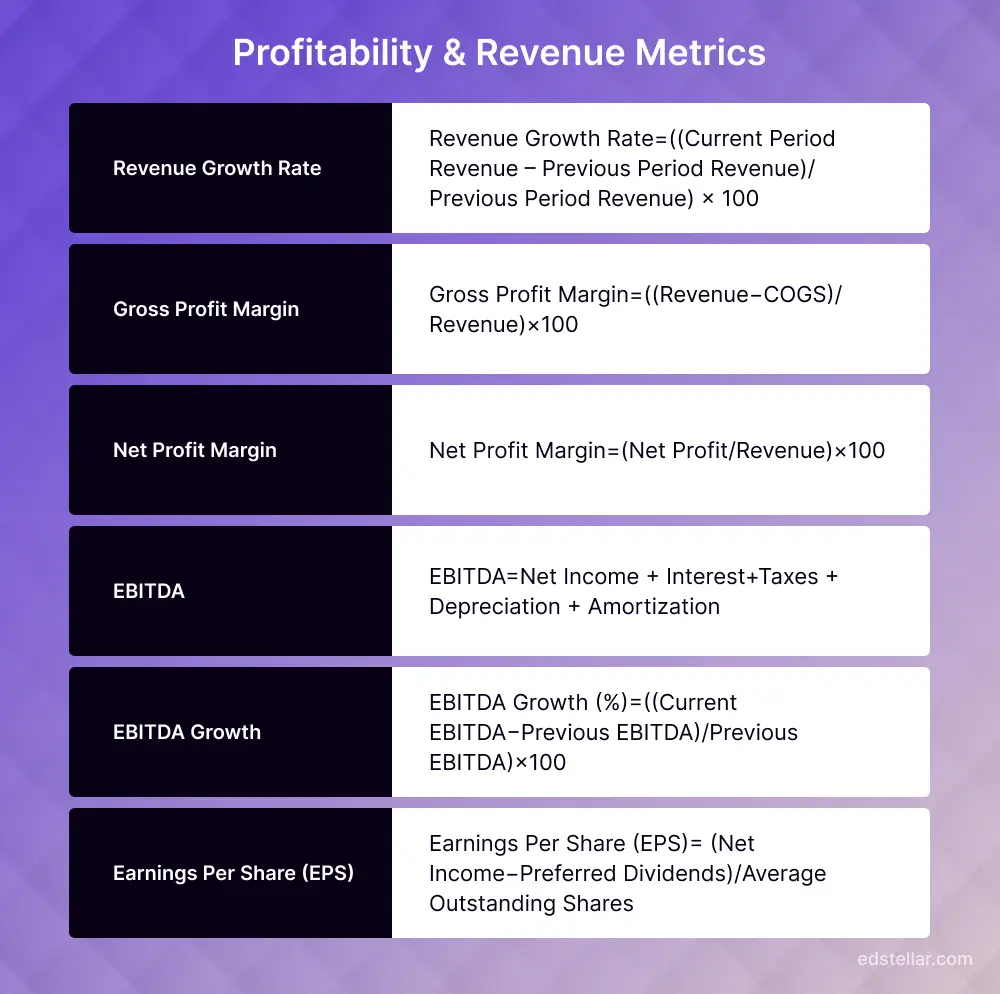
1. Revenue Growth Rate
The Revenue Growth Rate measures the percentage increase (or decrease) in a company’s sales from one period to the next:
- A consistently high or increasing revenue growth rate often signals a healthy, expanding business that is successfully gaining market share or growing sales from existing customers.
2. Gross Profit Margin
Gross Profit Margin reflects how efficiently a company converts revenue into gross profit by controlling the cost of goods sold (COGS). It represents the percentage of revenue that remains after accounting for direct production or service delivery costs.
- A higher gross margin indicates strong control over production costs and favorable pricing strategies. It gives insight into operational efficiency at the most fundamental level.
- Executives can use this metric to evaluate product profitability, identify underperforming service lines, and optimize pricing or supplier negotiations.
Example: If a software firm has a gross margin of 85%, it suggests that for every dollar of revenue, $0.85 is available to cover other operating expenses, a strong indicator of operational leverage.
3. Net Profit Margin
Net Profit Margin shows the percentage of revenue that remains as net income after all business expenses are deducted, including taxes, interest, and administrative costs.
- This is a comprehensive measure of profitability. A company might show strong revenue but still have a low or maybe negative net profit margin due to poor cost management or high overhead.
- Net profit margin helps leadership assess overall financial health, efficiency, and sustainability. It also serves as a key benchmark when comparing against industry peers or during investor evaluations.
4. EBITDA
EBITDA (Earnings Before Interest, Taxes, Depreciation, and Amortization) is a commonly used indicator of a company’s operational performance. It excludes non-operational and non-cash expenses to give a clearer picture of core profitability.
- EBITDA is particularly useful when comparing profitability between companies or over time, as it removes distortions from accounting decisions or capital structures.
- Executives often use EBITDA when evaluating potential acquisitions, securing financing, or benchmarking internal performance across business units.
5. EBITDA Growth
EBITDA Growth measures the change in EBITDA over time, offering a clear signal of whether core business profitability is improving.
- Even if revenue is growing, stagnant, or declining, EBITDA may point to rising operational costs or inefficiencies. Conversely, growing EBITDA signals that scale is being achieved profitably.
- This metric is crucial for evaluating internal cost control, scalability of operations, and the financial impact of strategic initiatives.
6. Earnings Per Share (EPS)
EPS measures how much profit is attributable to each outstanding share of stock. It is a fundamental metric for public companies and a key driver of investor confidence.
- EPS is widely tracked by shareholders and analysts to assess a company’s profitability and return on equity. It directly influences stock valuation and market perception.
- For CFOs and investor relations executives, maintaining and growing EPS is crucial in managing investor expectations and securing long-term capital.
Liquidity & Cash Flow Indicators
Liquidity defines how quickly an organization can convert assets into cash to meet its short-term obligations, a key focus for CFOs aiming to maintain operational resilience and capital agility. Cash flow metrics, on the other hand, reveal how effectively financial decisions translate into real, deployable funds. Together, these KPIs underpin an organization’s financial stability and growth readiness.
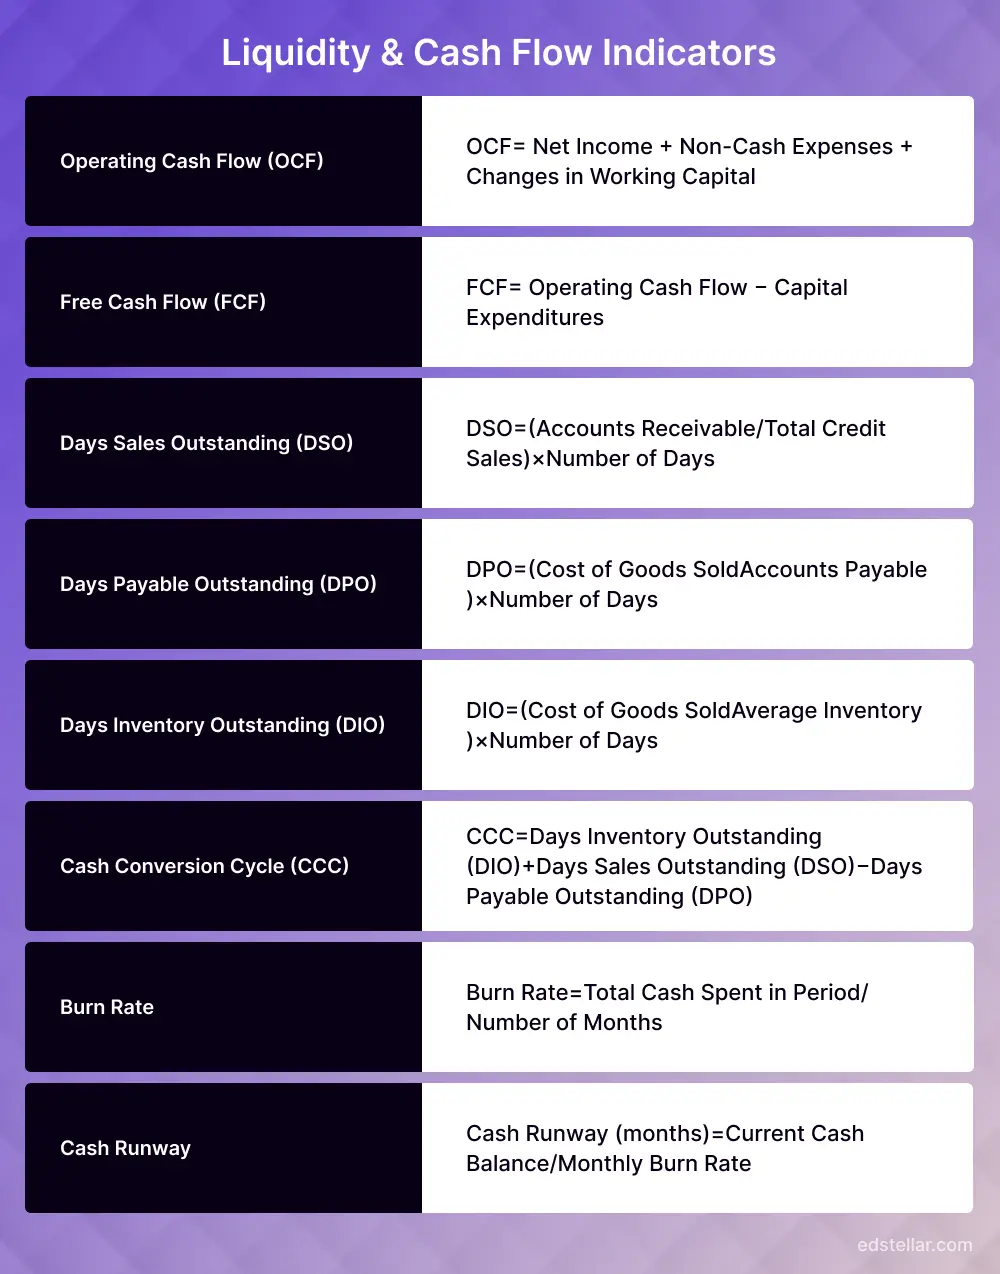
7. Operating Cash Flow (OCF)
Operating cash flow measures the cash a company generates from its core operations, the cash left after adjusting net income by changes in working capital and non-cash items. It signals whether the business operations themselves are producing real cash rather than just accounting profits. Analysts regard OCF as a more reliable indicator than net income alone because profits can be affected by non-cash items.
Consistent positive OCF signals sustainable operations and liquidity stability. A gap between high profits and low OCF may indicate hidden cash flow stress or accounting-driven profits.
8. Free Cash Flow (FCF)
Free cash flow is the leftover cash after you deduct capital expenditures from operating cash flow. It is the cash available to repay debt, return capital to investors, or fund new investments and innovation. A firm with strong and consistent free cash flow has the flexibility to sustain growth, weather downturns and make strategic moves. Research supports this: companies with robust free cash flows are typically better placed to respond to competitive pressures and to generate long-term value.
Strong and steady FCF gives CFOs room to maneuver to deleverage, reward investors, or reinvest confidently. Negative or volatile FCF signals high capital intensity or weak cash conversion.
9. Days Sales Outstanding (DSO)
Days' sales outstanding is the average number of days it takes a company to collect payment following a sale. A high DSO indicates slower conversion of credit sales into cash, which may reflect weak credit controls, collection challenges or customers under stress. Research from working-capital studies suggests that reducing DSO by even a few days frees up material cash for the business.
Rising DSO flags collection delays or customer credit stress.
Reducing DSO by even a few days can free up significant working capital.
10. Days Payable Outstanding (DPO)
Days payable outstanding measures how long the company takes to pay its suppliers. Extending DPO improves short-term liquidity by holding cash longer, but it must be balanced with supplier relationships and the risk of losing favorable terms. Studies suggest that optimizing this payment window improves working-capital efficiency without undermining supply-chain collaboration.
Higher DPO improves short-term liquidity, but excessive delays may strain supplier relationships.
The goal is to balance and align with industry norms while optimizing cash use.
11. Days Inventory Outstanding (DIO)
Days' inventory outstanding measures the average time inventory is held before it is sold. Inventory ties up cash and exposes the company to obsolescence, carrying costs, and margin erosion if product mixes change. Empirical evidence shows that reducing DIO improves return on assets and overall financial performance.
The CFO uses DIO to assess supply-chain efficiency, inventory policy, and demand alignment. If DIO increases, it may mean production or procurement levels are too high relative to demand, or that the business is carrying excessive safety stock. Addressing DIO can release cash and improve flexibility.
12. Cash Conversion Cycle (CCC)
The cash conversion cycle (CCC) measures the number of days between paying for inventory or inputs and collecting cash from customers (plus time inventory sits in stock, minus time supplier terms allow you to delay payment). It brings together the working-capital dynamics of receivables, payables, and inventory. Research shows that shorter cash conversion cycles are associated with better firm performance because they reduce capital tied up in the business and accelerate cash availability.
A shorter CCC means faster cash turnover and better working-capital discipline. Each day reduced in CCC improves liquidity and funding agility.
13. Burn Rate
Burn rate is especially relevant for growth-oriented companies or those in weaker cash positions. It measures how fast the company is spending cash reserves , essentially, how many months the business has before cash resources run out if no new inflows occur.
From the CFO's vantage point, burn rate is a key risk parameter. Monitoring monthly burn against milestones, linking burn to value creation, and ensuring visibility of runway are critical. It forms part of the narrative to investors, creditors, and internal stakeholders about how well the business is managing its cash runway.
14. Cash Runway
Cash runway calculates how long the business can continue operating at the current burn rate before running out of cash. It is a forward-looking measure of financial resilience. While there is less formal academic work specifically on runway, practitioners stress the importance of maintaining sufficient runway to absorb shocks and pursue opportunities.
For a CFO, cash runway is a strategic indicator. It influences decisions around capital raising, cost structure, growth timing, and risk management. Maintaining at least a moderate runway allows the business to act rather than react.
Financial Efficiency & Return Metrics
Financial efficiency indicators reveal how well a company uses its resources, both assets and capital, to create shareholder value. For CFOs, these are not just ratios; they are strategic tools for aligning operations, investments, and risk with performance outcomes.
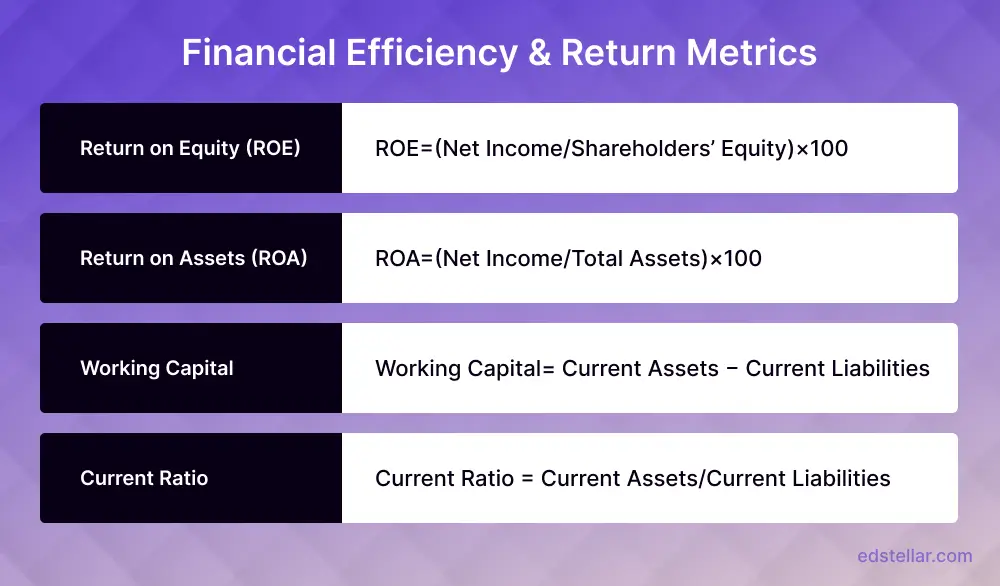
15. Return on Equity (ROE)
Return on Equity (ROE) measures how much net income is generated from each dollar of shareholder equity. It indicates the profitability and capital efficiency of the company.
A research brief from Harvard Business School Online emphasizes that ROE provides insight into how management converts investor funds into profit. The study explains that a high ROE demonstrates efficient use of equity. At the same time, a low ROE can point to excess retained earnings or underutilized capital.
CFOs use ROE to assess long-term shareholder value creation and ensure that equity-funded initiatives deliver returns exceeding the firm’s cost of capital. It’s also a signal to investors about leadership’s capital discipline.
16. Return on Assets (ROA)
ROA measures how efficiently total assets, both fixed and current, generate profit. It’s especially relevant in capital-intensive industries such as manufacturing or utilities.
An investment study analyzed over 3,000 global firms and found a direct link between sustained ROA improvement and long-term stock outperformance. The research concluded that companies with ROA above 10% consistently achieve more substantial total shareholder returns and better capital stewardship because they manage both operational and financial efficiency simultaneously.
A CFO monitoring ROA ensures assets are not sitting idle. When ROA declines, it often means capital investments are not yielding expected results, requiring reallocation or efficiency reforms.
17. Working Capital
Working capital represents the short-term liquidity buffer available to fund daily operations. It’s calculated as the current assets minus current liabilities and directly reflects the company’s cash cycle efficiency.
This KPI ensures sufficient liquidity to meet short-term obligations, supporting operational continuity and growth without reliance on external financing.
KPMG's 2025 cash flow leadership report highlights that proactively managing working capital, through aligned metrics, dedicated leadership, and transparent accountability, is a key driver of ROIC and a critical differentiator between financially resilient and financially vulnerable organizations.
Working capital is a CFO’s primary control over liquidity. Efficient management not only improves cash flow but also allows reinvestment without increasing debt exposure.
18. Current Ratio
The Current Ratio compares current assets to current liabilities, indicating whether short-term obligations can be met without external financing.
An industry analysis found that organizations maintaining a current ratio between 1.2 and 2.0 have significantly fewer credit downgrades and demonstrate better financial resilience during market stress. The study linked healthy liquidity ratios with more substantial supplier confidence and improved negotiation power.
A balanced current ratio means the company can meet obligations while still keeping capital productive. A ratio below 1.0 signals liquidity strain; above 2.0 may indicate excessive idle assets.
Leverage & Risk Management Metrics
CFOs must carefully manage leverage, using debt to amplify growth without exposing the organization to solvency risk. These KPIs balance profitability with protection against volatility.
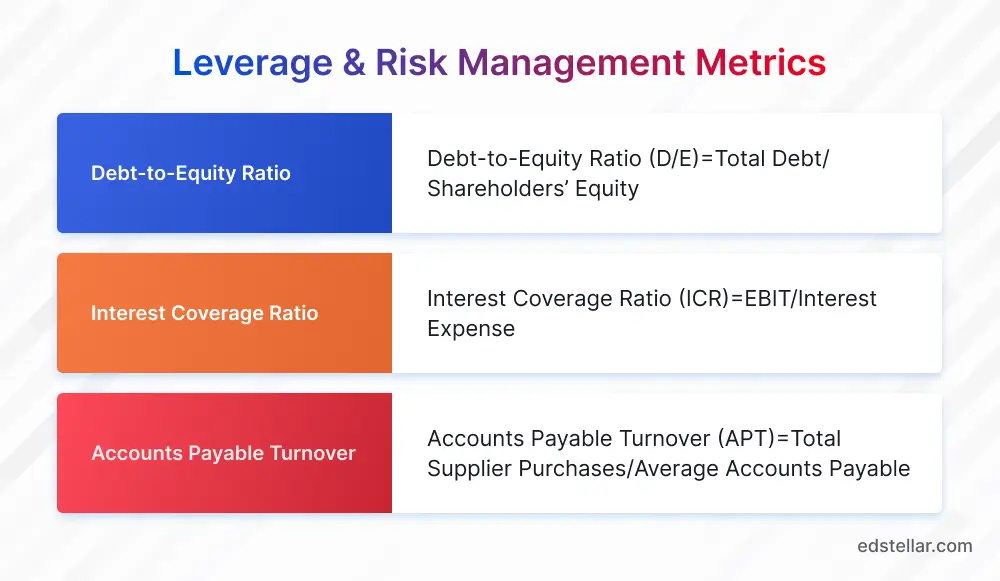
19. Debt-to-Equity Ratio
This metric assesses how much of a company’s financing comes from debt versus shareholders’ equity. It is a core measure of financial leverage and risk tolerance.
A macroeconomic analysis explored how firms with moderate leverage (D/E ratios below 1.5) maintain investor confidence and stability. The study concluded that balanced leverage improves funding availability during downturns because lenders perceive such firms as lower-risk borrowers.
CFOs use this metric to communicate solvency discipline to stakeholders and ensure capital structure aligns with the firm’s strategic growth horizon.
20. Interest Coverage Ratio
Interest Coverage Ratio (ICR) measures how comfortably earnings before interest and taxes (EBIT) can cover interest expenses. It’s essential for assessing debt-servicing capacity.
A Springer study analyzed 1,200 companies and found that firms maintaining an ICR above 3 consistently experienced lower default probability. The research emphasized that companies with higher coverage ratios benefit from investor confidence and lower cost of borrowing.
A falling ICR warns of tightening margins or rising interest costs. CFOs must assess whether debt restructuring or cost reduction is needed to maintain solvency stability.
21. Accounts Payable Turnover
Accounts Payable Turnover evaluates how quickly a company pays its suppliers. It directly affects both liquidity and supplier relationships.
Allianz Trade's financial KPI guidance emphasizes that tracking accounts payable alongside DSO and working capital requirements gives companies a real-time assessment of their cash position, helping finance leaders anticipate funding needs and maintain supplier trust.
A CFO should track this metric not only for liquidity efficiency but also to balance payment terms strategically , paying early where discounts apply and extending terms only when supplier relations allow.
Operational Efficiency Metrics
Operational efficiency metrics show how well a company converts inputs, like labor, materials, and time, into outputs that generate revenue. For CFOs, they bridge financial performance with organizational productivity, revealing whether processes are scalable or draining profitability.
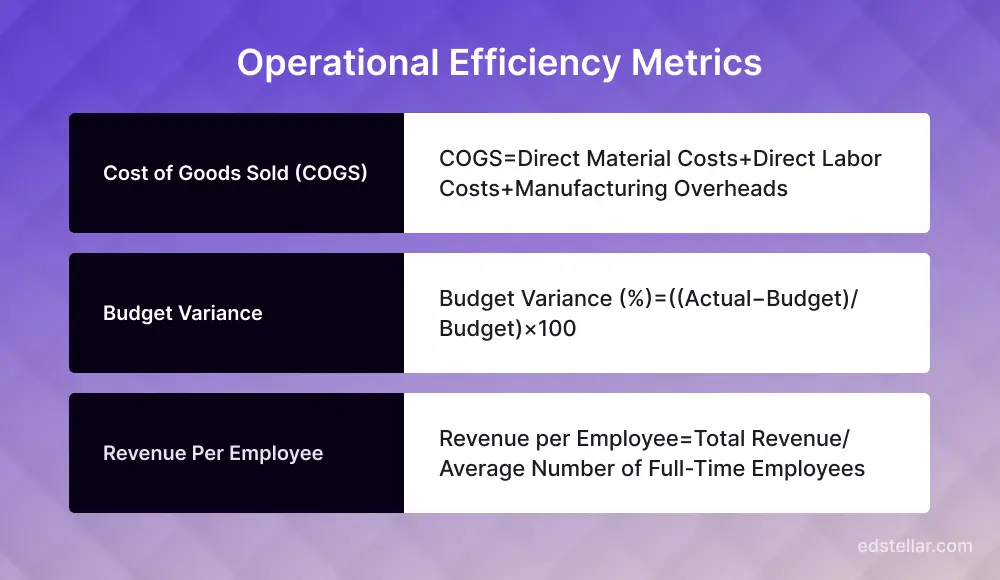
22. Cost of Goods Sold (COGS)
COGS represents the direct costs tied to producing or delivering a product, including materials and labor. For manufacturers and service-based companies alike, it’s a key measure of operational cost efficiency.
For CFOs, tracking COGS reveals how supply chain volatility, inflation, or production inefficiencies affect profitability. Improving procurement contracts and reducing waste directly impacts EBITDA growth.
23. Budget Variance
Budget variance compares actual financial performance against planned targets. It identifies where spending or revenue deviates from expectations, helping CFOs refine forecasts and improve accountability.
By examining variances monthly, CFOs can distinguish between controllable and uncontrollable costs, strengthen internal controls, and adjust resources quickly when performance drifts from plan.
24. Revenue Per Employee
Revenue per employee quantifies workforce productivity by dividing total revenue by the number of full-time employees. It’s a reflection of how efficiently human capital drives business results.
PwC's Workforce of the Future research indicates that companies prioritizing workforce productivity through automation and skills development consistently report better capital efficiency ratios, making revenue per employee a leading indicator of long-term financial health.
CFOs use this KPI to balance staffing levels with revenue growth. A declining trend may suggest overstaffing or inefficiency, while an upward trend indicates optimized workforce productivity. It also serves as a key input for compensation and automation investment strategies.
Conclusion
The role of the modern CFO extends far beyond accounting oversight. It encompasses strategic decision-making, digital transformation, and the cultivation of financial resilience.
Tracking and interpreting these 25 CFO KPIs, from cash flow stability to employee productivity, allows finance leaders to turn data into strategy and performance into growth.
At Edstellar, our Leadership and Financial Analytics programs help CFOs and finance executives build the analytical thinking, risk management, and strategic communication skills required to use these KPIs effectively.
Explore the Skills Matrix or browse our Finance Leadership Courses to transform how your organization measures and manages success.
Frequently Asked Questions
🔗 Continue Reading
.svg "Click Here to Follow on Medium")
Explore High-impact instructor-led training for your teams.
#On-site #Virtual #GroupTraining #Customized
Edstellar Training Catalog
Explore 2000+ industry ready instructor-led training programs.

Coaching that Unlocks Potential
Create dynamic leaders and cohesive teams. Learn more now!
Explore 50+ Coaching Programs

Want to evaluate your team’s skill gaps?
Do a quick Skill gap analysis with Edstellar’s Free Skill Matrix tool
Get Started

Transform Your L&D Strategy Today
Unlock premium resources, tools, and frameworks designed for HR and learning professionals. Our L&D Hub gives you everything needed to elevate your organization's training approach.
Access L&D Hub Resources.svg)
Featured Post
More Blog Insights
Tell us about your corporate training requirements
FOLLOW US