12 Essential KPIs & Metrics for Measuring Change Management Success

.svg "edstellar")


Let’s face it: you can’t just wing change management anymore. Leaders want hard proof that your efforts are paying off. That’s where measuring outcomes comes in. It’s not just a nice-to-have; it’s the backbone of making change work. By tracking the right key performance indicators (KPIs), you can spot problems early, show real results, and prove the value of your work.
Research from Prosci shows effective change management can deliver 3–6× the return on investment of a project. In contrast, the often-quoted “70% of changes fail.” This statistic reminds us that failure is common without discipline. Besides, projects with solid change management are six times more likely to hit their goals than those with poor change practices..
Change itself is a core capability in today’s economy, driven by relentless digital transformation, shifting market dynamics, and increasing regulatory demands. Done right, change can be a game-changer for your business. Organizations that master change gain a competitive edge, turning disruption into opportunity. BCG points out that a single botched IT project can bleed a company over €20 million a year.
By tracking things like adoption rates or how well your leaders are steering the ship, you turn change from a risky bet into a strategic win. Measuring KPIs ensures your change efforts deliver real value, cut down on risks, and set your organization up to handle transformation like a pro.
In this blog, we break down 12 essential KPIs to measure change management success, giving you a clear roadmap to boost ROI, track progress, and make change a competitive edge. Along the way, we’ll share corporate training solutions to help turn change into a strategic advantage.
“During the early stage of your change, be sure to present a case for the resources you will need to measure progress over time. You can do this by linking effective adoption and usage to project results and outcomes, including ROI. How much of the project’s expected ROI depends on adoption and usage? ”

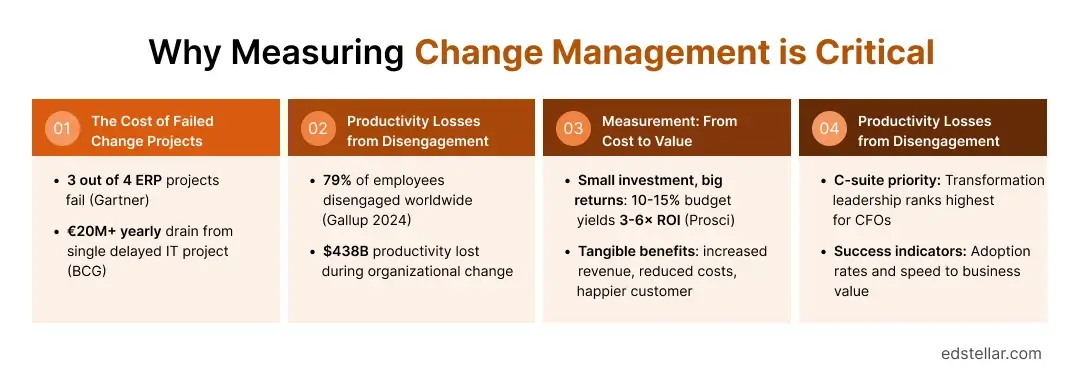
Before diving into metrics, it’s critical to understand why measurement is a strategic necessity. Poorly managed change isn’t just a minor setback; it’s a bottom-line drain.
1. The Cost of Failed Change Projects
Failed change projects are initiatives like new software rollouts or process overhauls that miss goals, run over budget, or derail entirely.
2. Productivity Losses from Disengagement
Disengagement happens when employees feel unsupported or confused during change, reducing their output.
3. Measurement: From Cost to Value
Measuring change tracks progress and success to ensure projects deliver results.
4. Building Executive Confidence
Clear metrics show leaders that change projects are worth the investment.
A proven model from Prosci clarifies how to break down change outcomes into measurable layers. Prosci recommends a three-level framework for metrics: Organizational performance (overall business results), Individual performance (employee adoption and usage), and Change management performance (execution of change activities).
Each level asks distinct questions: Did the project deliver its objectives? (Organizational), Did people adopt and use the change? (Individual), And how well was the change process managed? (Change management). By measuring all three, leaders get a full picture of success.
To clarify Prosci’s three-level measurement framework, consider an example: an organization rolls out new CRM software, and the table below outlines how each level is measured, with specific metrics and their impact, showing how well-executed activities lead to adoption and drive business results.
To clarify Prosci’s three-level measurement framework, consider an example: an organization rolls out new CRM software, and the table below outlines how each level is measured, with specific metrics and their impact, showing how well-executed activities lead to adoption and drive business results.
In Prosci’s words, “organizational and individual performance measure outcomes, while change management performance measures activities.” Together, these layers form a cascade: well-executed change activities enable individual adoption, which in turn drives the organizational results (meeting targets, generating ROI).
To implement the three-level framework, business leaders typically track a core set of 12 KPIs, grouped into strategic impact, operational adoption, and risk/control categories:
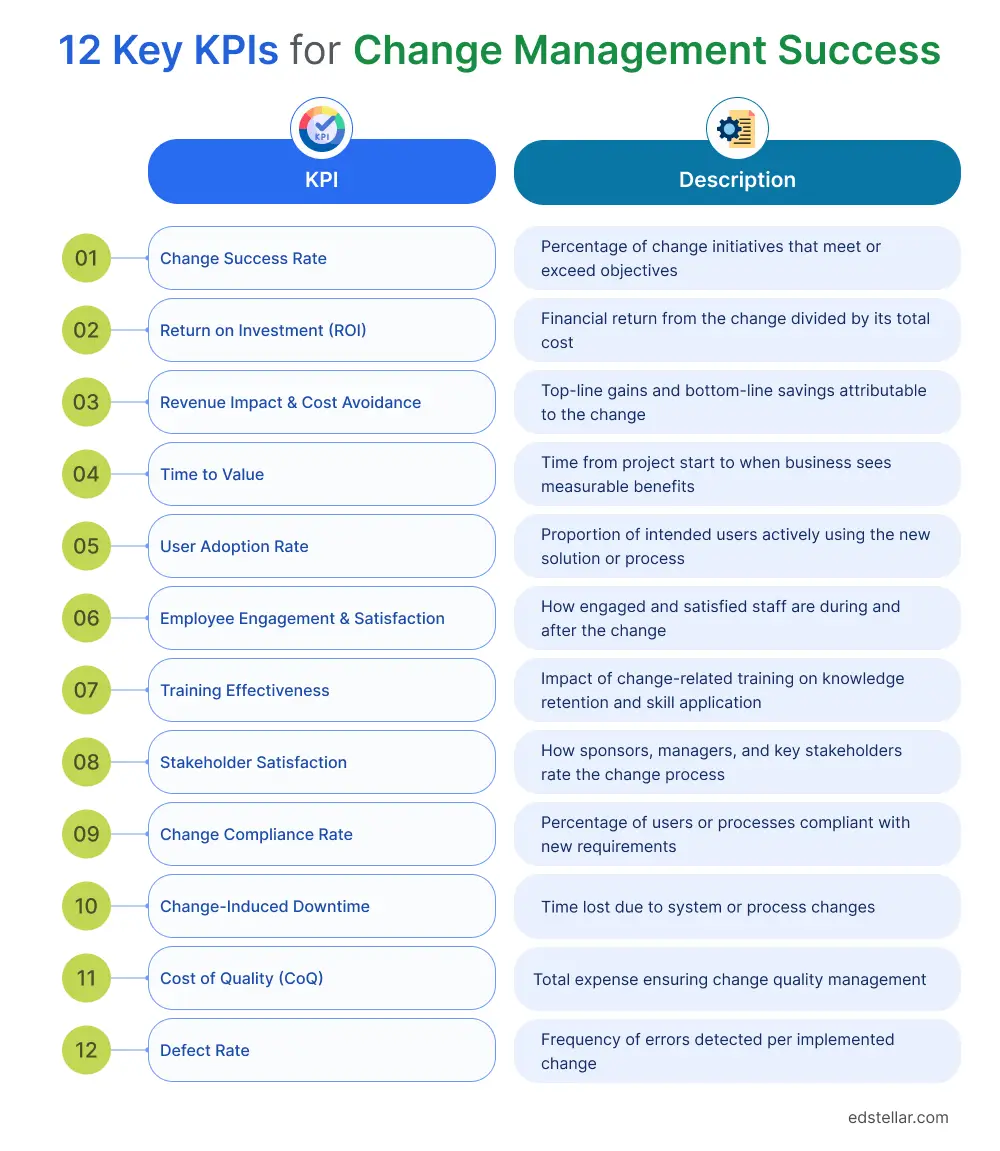
Each of these KPIs should be tied back to strategic goals and measured consistently. By tracking all 12, leaders get a panoramic view of change performance, from high-level ROI to granular adoption details. Together, they form a balanced scorecard of change success, covering strategic benefits, operational uptake, and risk control.
Effective training is a cornerstone of change adoption. Well-designed corporate training programs prepare teams to implement change smoothly and measure success metrics effectively. For example, specialized courses from Edstellar’s Corporate Change Management Training Course or Corporate Driving Change Training Course provide structured learning on the tools, models, and KPIs discussed above.
These programs teach participants to establish clear success definitions, develop adoption plans, and use real-world simulations to practice communication and stakeholder alignment. Embedding training into the change process ensures people have the knowledge and mindset to achieve the target KPIs; increasing adoption rates, reducing resistance, and ultimately boosting ROI.
In other words, corporate training helps turn the theory of metrics into practical expertise, making change success in everyone’s capability.
Basic measurement of change management, such as tracking simple metrics like completion rates or initial adoption, falls short of delivering strategic impact. Advanced measurement strategies are critical to navigate the complexity of large-scale transformations, ensure precise attribution of outcomes, and maximize ROI.
As changes grow in scope and speed, driven by digital innovation and market pressures, leaders need sophisticated tools to uncover hidden risks, validate investments, and drive continuous improvement. By moving beyond surface-level data, savvy leaders transform measurement into a proactive tool for sustained success.
Let’s discuss advanced measurement strategies for business leaders to enhance change management outcomes to ensure accurate outcome attribution, and maximize ROI.
To effectively measure complex change initiatives, organizations must harness modern technology and tools designed for data integration, real-time analytics, and scalability. Business intelligence (BI) platforms, such as Tableau or Power BI, enable leaders to consolidate data from diverse sources such as HR systems, project management software, and employee surveys into actionable insights.
Change management platforms, like Prosci’s ADKAR-based tools or ServiceNow’s change modules, streamline KPI tracking by aligning metrics with change frameworks.
Additionally, HR analytics tools (e.g., Workday or SAP SuccessFactors) can automate the collection of employee engagement and adoption data, while survey platforms like Qualtrics provide real-time feedback analysis. These tools create a robust infrastructure for measurement, ensuring data accuracy, accessibility, and alignment with strategic goals.
By selecting and integrating the right technologies, organizations lay the groundwork for advanced measurement, enabling seamless tracking of the 12 KPIs discussed in this blog.
Set up a centralized dashboard of KPIs for real-time visibility. Use SMART objectives (Specific, Measurable, Achievable, Relevant, Time-bound) to frame each metric and assign clear ownership. Combine leading indicators (like training completion) with lagging indicators (like ROI) in a balanced scorecard. Many organizations use BI tools or change management platforms to integrate data from surveys, HR systems, and project plans. The goal is a single pane of glass where executives can see progress on all 12 KPIs at a glance, filterable by project or timeframe.
Beyond simple ROI, factor in intangibles. Advanced approaches allocate portions of benefits to the “people side” of projects, as in Prosci’s model. For example, one can estimate the people-dependent ROI by surveying sponsors about what percentage of outcomes depends on user adoption (and conversely, how much budget is allocated to driving that adoption). This gap highlights underinvestment.
Techniques like Employee Lifetime Value (ELTV) also help: for instance, retaining a skilled worker due to a smoother change might be valued in terms of hiring/training costs saved. While complex, doing this analysis impresses finance teams and justifies further change investment.
Use sound research methods to ensure metrics are valid. Where possible, implement control groups or phased rollouts to compare impacted vs. untouched units (quasi-experimental design). Always measure metrics consistently (e.g., same survey questions) so that year-over-year comparison is fair. Ensure sample sizes are large enough for statistical confidence. Adopt data governance principles that are clean, single sources of truth, so that KPI tracking isn’t derailed by poor data.
Finally, practice attribution carefully: for example, if sales improve after a CRM launch, strip out market trends or seasonality to isolate the change’s effect. Triangulating metrics (looking at multiple KPIs for the same outcome) also reduces bias. Treat measurement itself as an iterative process: regularly review which KPIs are most predictive of success and refine them.
Even with a solid plan, watch out for traps that can undermine your metrics:
As a case in point, neglecting the people's side of projects can trigger hidden costs. Prosci notes that ineffective change management leads to “rework, redesign, rescoping, and other consequences” that inflate timelines and budgets. In other words, measuring poorly can itself cost you more in surprises later. By contrast, disciplined tracking of the right KPIs prevents these issues, protecting both schedule and ROI.
Modern software can help gather and visualize change KPIs:
Invest in training your analytics team on change-specific questions (for example, time-to-value analysis or engagement modeling). Over time, embed measurement experts within business units so each team learns to set and track its change metrics.
A mature culture even uses metrics as a dialogue starter: celebrating when targets are met, and treating misses as joint problem-solving opportunities. The ultimate goal is that every leader uses change KPIs in boardroom discussions, making successful change management a true strategic advantage.
Successful organizations don’t treat change management as guesswork they treat it as a measurable, strategic discipline. By defining 3–5 clear success metrics and tracking them across the project lifecycle, businesses can move from reactive problem-solving to proactive, data-driven optimization.
The 12 KPIs covered in this guide help answer crucial questions:
When linked to measurable outcomes like ROI, time-to-value, or stakeholder alignment, these KPIs drive visibility, accountability, and real-time course correction.
But identifying metrics is only part of the solution. The real value lies in your team’s ability to consistently measure, analyze, and act on them something many organizations struggle with.
That’s where a trusted partner like Edstellar comes in.
Edstellar’s instructor-led Corporate Change Management Training helps teams master the frameworks, tools, and habits needed to lead measurable, sustainable change. Delivered by industry experts and customized to your goals, it transforms capability into competitive edge.
Why choose Edstellar?
Edstellar supports organizations across 100+ countries, helping them stay agile, skilled, and ready for tomorrow.
The takeaway is clear: When you measure change the right way, with the right KPIs, the right training, and the right support; you gain a competitive edge that turns disruption into opportunity. Change doesn’t have to be chaotic. With a strong measurement strategy and an empowered workforce, it becomes your most valuable lever for growth.
#On-site #Virtual #GroupTraining #Customized
Explore 2000+ industry ready instructor-led training programs.

Create dynamic leaders and cohesive teams. Learn more now!

Do a quick Skill gap analysis with Edstellar’s Free Skill Matrix tool

Unlock premium resources, tools, and frameworks designed for HR and learning professionals. Our L&D Hub gives you everything needed to elevate your organization's training approach.
Access L&D Hub Resources.svg)
.svg "Click Here to Follow on Medium")